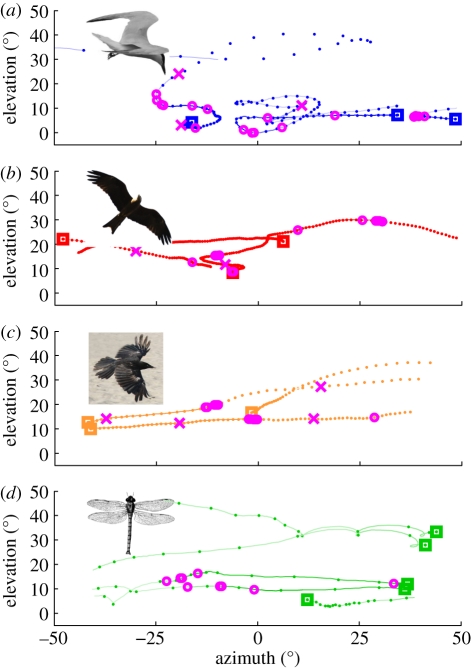
Figure 2.
Typical example flight paths, as seen from crab perspective, of several (a) terns, (b) kites, (c) commuters and (d) insects. Squares mark the start of each path, and dots indicate position every 200 ms. Individual paths were off-set horizontally for visibility. Crab responses are shown as magenta circles for home runs and crosses for burrow entries. If several responses occurred at the same time, circles were slightly offset for clarity. The saturation of the traces indicates the percentage of crabs that are still active on the surface: no line between points indicates that all previously active crabs have run home. In concurrent tracks, response markers are shown on both tracks.

