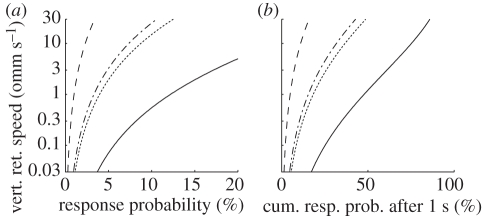
Figure 4.
(a) Predicted response probabilities in a 200 ms interval after 200 ms of observation as a function of vertical retinal speed for both levels of the factor ‘horizon’ and two values of flicker. H +/F80, for instance (black line) indicates the response probability for strongly flickering objects at the horizon. (b) Accumulated response probabilities after observing the same stimulus for 1 s. Note the difference in horizontal axis scales between (a) and (b). Dashed lines, H−/F20; dotted lines, H+/F20; dashed-dotted lines, H−/F80; solid line, H+/F80.

