Figure 3.
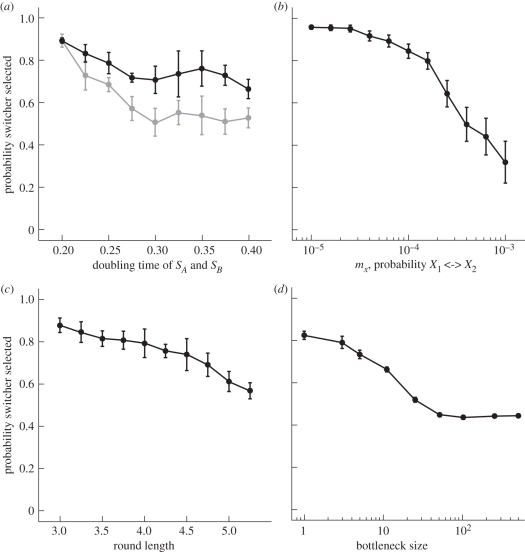
Resilience of a switcher. (a) To examine the effect of growth rate on the invasion of a switcher from rare, we varied the doubling time for SA and SB from 0.2 to 0.4 and calculated the number of times a switcher was selected for rounds of length 3.5 (black) and 4.0 (grey) time units. As in figure 2c (and the rest of figure 3), each point is a mean of five samples of 10 simulations run for 125 rounds with the first 25 discarded to avoid biasing the results in favour of the initial inoculum (the X phenotype). The error bars show the standard deviation. The switcher can invade from rare despite longer doubling times. (b) We repeat the process as in (a) except the mutation probability is varied between non-switching phenotypes from 10−5 to 10−3. The switcher wins more than 50% of the time until a mutation probability above 0.0003, when the switching rate is only 3.3 times greater. (c) The round length ranges from 3.0 to 6.0 (a round length of 3.5 is used through the rest of the study). Increasing the round length gives more time for the faster growing non-switchers to outcompete the switcher. Even at a round length of 6.0 when the switcher divides up to six times less than the non-switching phenotypes, it still is selected in almost 50% of the rounds. (d) The bottleneck size is varied and the exclusion rule is implemented by preventing the organism that represents the majority of an inoculum from continuing on to the next round. The switcher wins more often than non-switching phenotypes so long as the bottleneck is below 10, otherwise faster growing phenotypes outcompete the switcher because they are no longer hampered by their diminished mutation probability.

