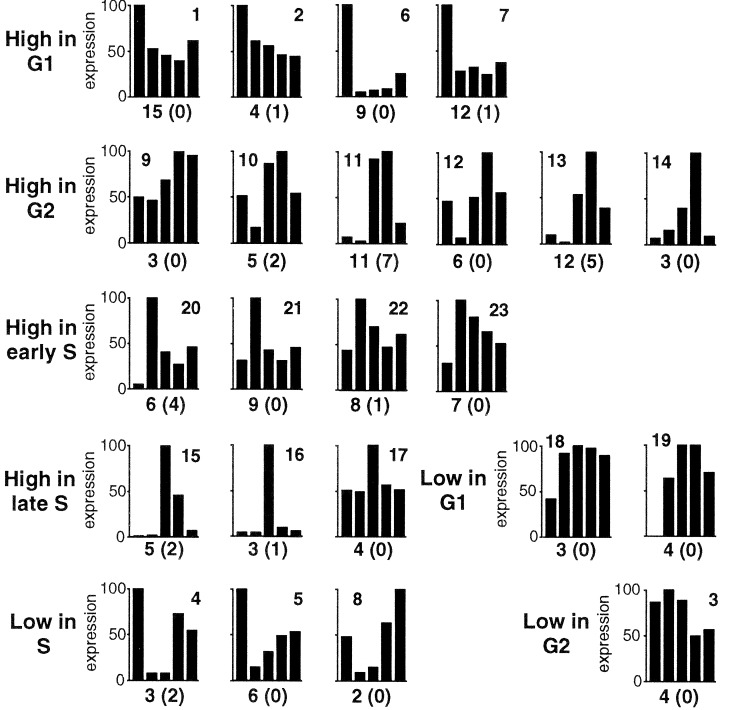
Figure 2.
Coexpression groups with distinct cell cycle expression profiles are contained within 23 clusters. The bars represent the mean relative synthesis levels (as percentage of the maximum value) of all members of a cluster at the five cell cycle time points indicated in Fig. 1C. The values of each individual member of a cluster were calculated from six independent repeats and the changes were significant at the 99% confidence level. The clusters are grouped according to the timing of the highest or lowest expression value. The number on top of each chart indicates the cluster number. The total number of protein spots assigned to each cluster is indicated at the bottom of each chart with the number of unstable spots in parenthesis.

