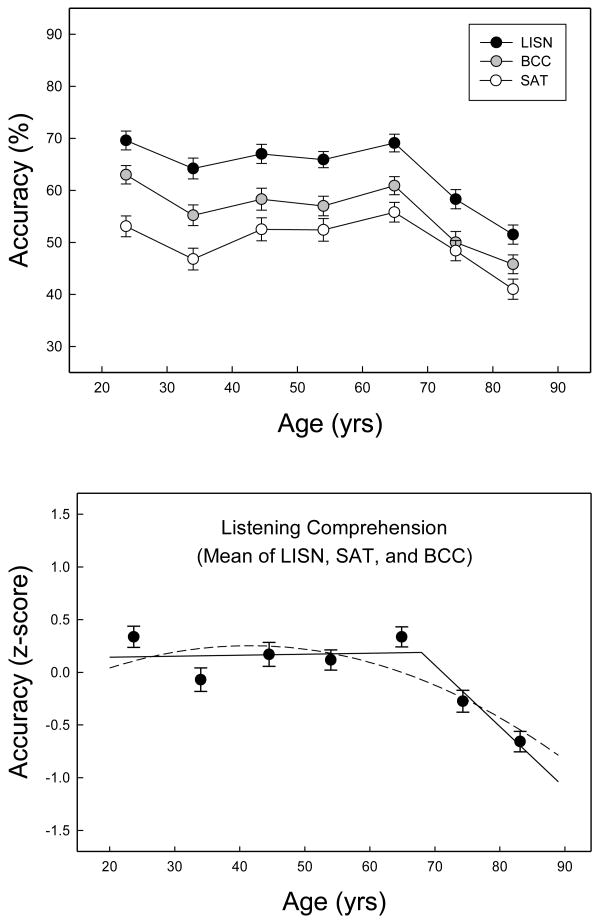
Figure 2.
(top) Mean percent correct for the LISN, SAT, and BCC measures of comprehension plotted as a function of age group. Error bars represent standard errors of the mean. (bottom) Piecewise (solid line) and polynomial (dashed line) fits to mean (z score) listening comprehension performance across the three measures (BCC, SAT, and LISN) as a function of age.

