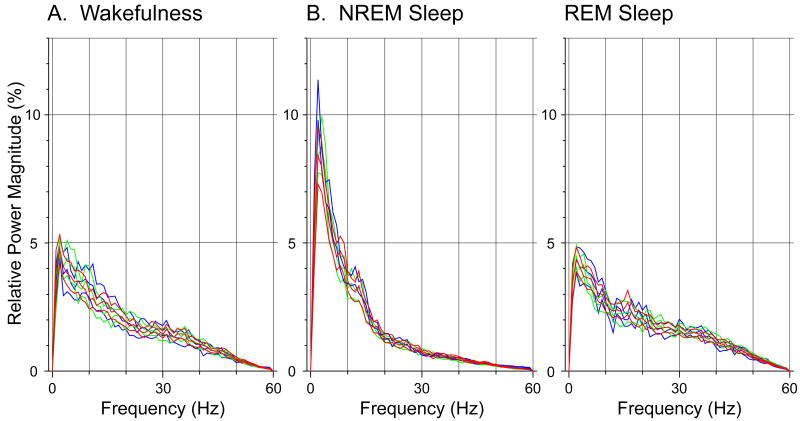
Figure 6.
The EEG power spectrum is not altered following antisense OD administration. The mean frequency distribution obtained from frontal EEG recordings during wakefulness, NREM sleep, and REM sleep (A, B, and C, respectively) were similar, i.e., the confidence intervals overlapped, for baseline, control OD, and antisense OD recording sessions (indicated by green, blue and red line curves, respectively). Each curve is the mean power spectrum pooled from five representative, 10 second episodes of each behavioral state that were obtained from representative baseline (5 cats), control OD (3 cats), and antisense OD (5 cats) recording sessions.

