
Figure 2.
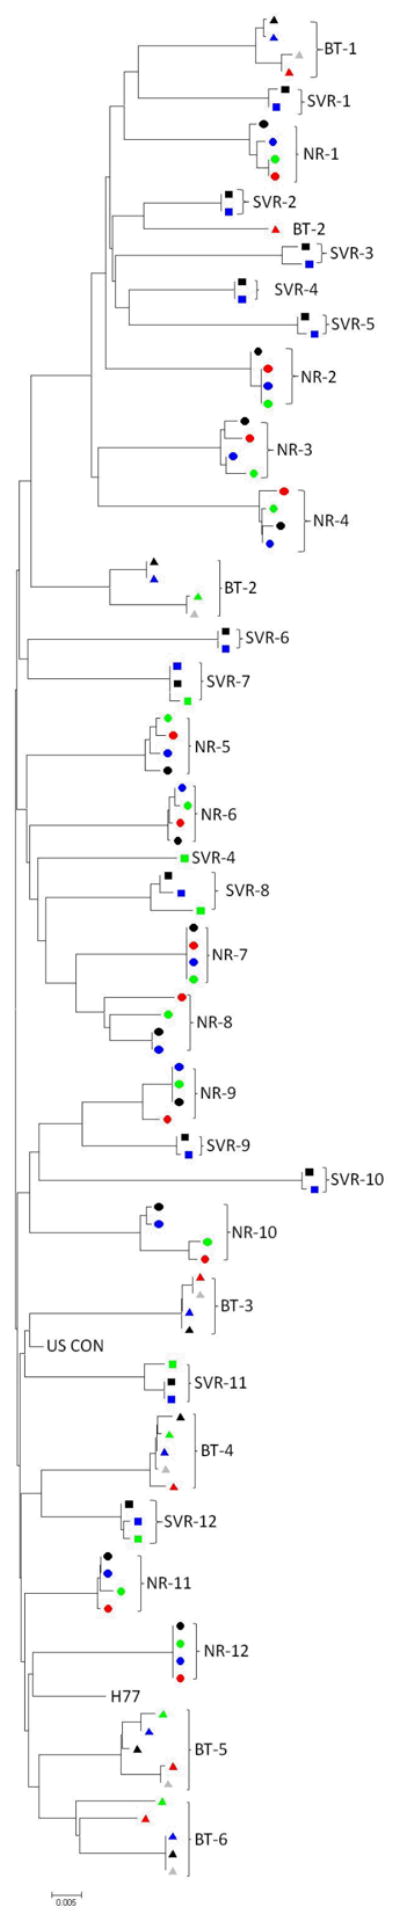
Phylogenetic analysis of sequences from non-responders (●), SVR (■) and BT (▲) patients. In the phylogenetic tree of baseline nucleotide sequences, there were no significant clusters of sequences according to response. When nucleotide sequences from later time points (black: Baseline, blue: wk 4, green: wk 12, red: BT (or wk 24 in NR), grey: post-BT) were added, the later time point sequences diverged slightly from baseline sequences, but still clustered around the patient profile, rather than response to therapy.