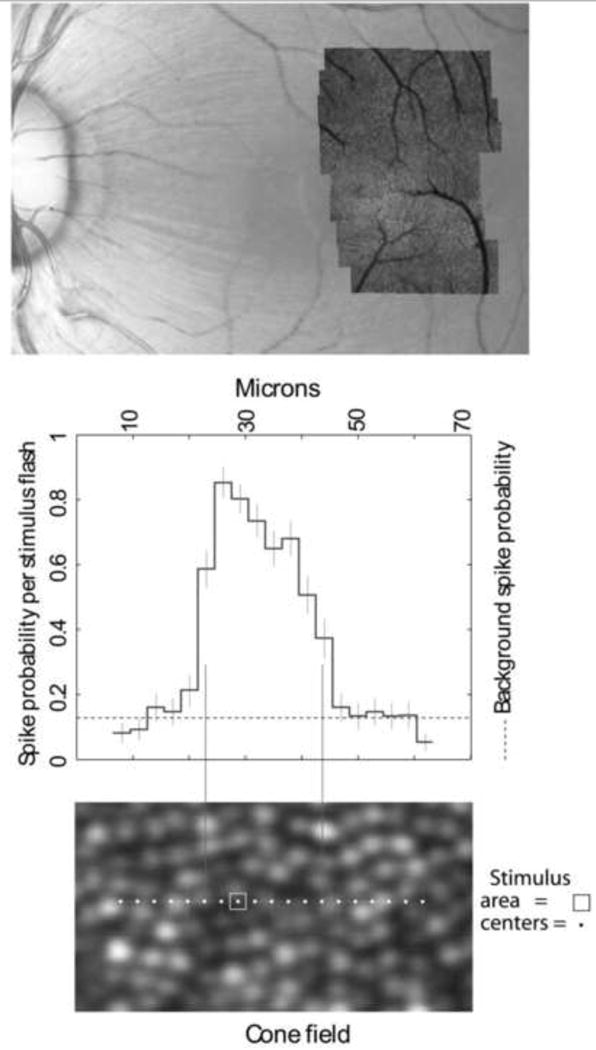
Fig. 12.

Mapping single cone cell inputs to the receptive fields of LGN cells recorded with a microelectrode in the monkey. Upper panel: color fundus photograph of macaque retina with an AOSLO montage overlay. The red dot indicates the location of the receptive field that is shown in the two lower panels. The lower panel shows the exact locations of the test areas. The central plot shows the probability that each stimulus flash will produce a neural spike (Adapted from Sincich et al., 2009). From Roorda (2010).
