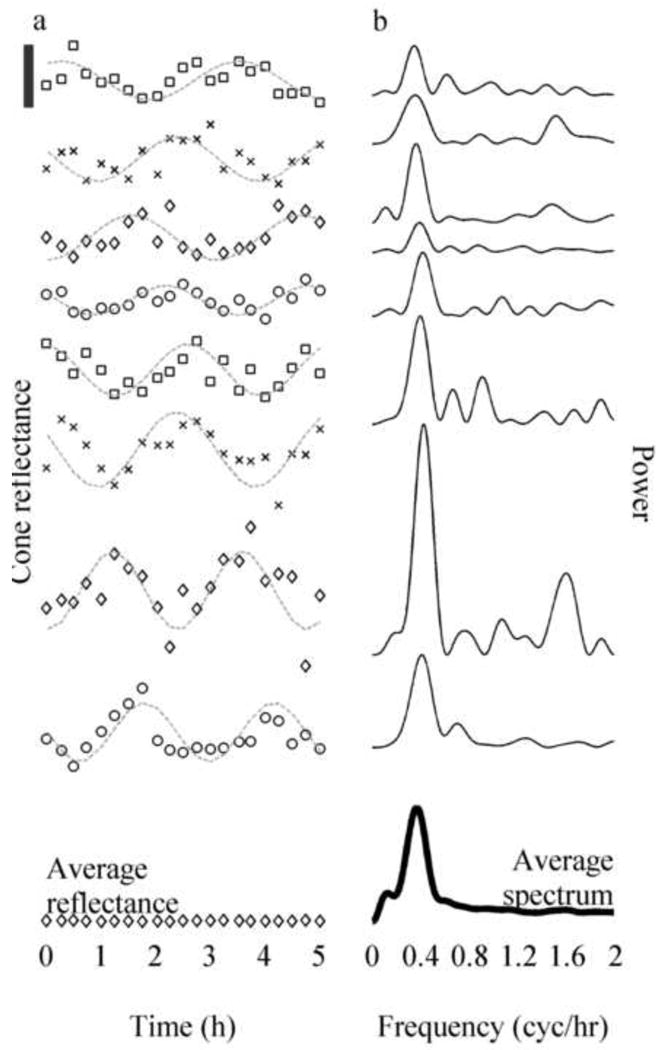
Fig. 18.

Cone reflectances and their power spectra (plots offset vertically for ease of viewing). (a) Reflectance as a function of time of eight sample cones taken from trial 4. Superimposed on each plot is a cosine fit (gray line). The black bar in the upper left shows 1/10th of the average DC component, I0, of cone reflectance. The oscillation of reflectance in all cones had a visible period of 2.5 – 3 hours, while the amplitudes and phases appeared to vary randomly. At the bottom is a plot of the average reflectance of all cones (diamonds), nearly flat (contrast 0.18%), which is predicted by the model shown in Fig. 1(c) and Eq. (1). (b) Power spectra of mean-subtracted cone reflectance traces shown in a, and the average spectrum of all 1626 cones (dark line). Most cones in this trial had a visible peak in the power spectrum around 0.37 cyc/hr, and this peak is visible in the average power spectrum as well. Similar peaks were seen in power spectra of individual cones, and the average power spectrum, in all trials in which the long coherence source was used (these frequencies are summarized in Table 1). When the short coherence source was used, neither the power spectra of individual cones nor the average power spectrum showed comparable peaks. From Jonnal et al. (2010).
