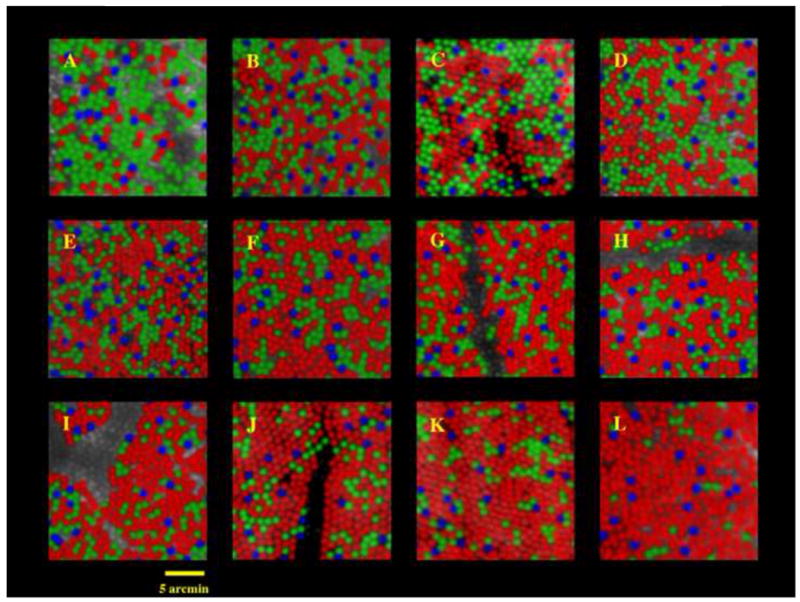
Fig. 8.

Images of the cone mosaics of 10 subjects with normal color vision, obtained with the combined methods of adaptive optics imaging and retinal densitometry. The images are false colored so that blue, green, and red are used to represent the S, M, and L cones respectively. (The true colors of these cones are yellow, purple, and bluish-purple). The mosaics illustrate the enormous variability in L/M cone ratio. The L/M cone ratios are A,0.37, B, 1.11, C, 1.14, D, 1.24, E, 1.77, F, 1.88, G, 2.32, H, 2.36, I, 2.46, J, 3.67, K, 3.90, L, 16.54. The proportion of S cones is relatively constant across eyes, ranging from 3.9 to 6.6% of the total population. Images were taken either 1 or 1.25 deg from the foveal center. For two of the 10 subjects, two different retinal locations are shown. Panels D and E show images from nasal and temporal retinas respectively for one subject; J and K show images from nasal and temporal retinas for another subject. Images C, J, and K are from Roorda and Williams (1999). All other images are from Hofer et al. (2004). From Williams and Hofer, H. (2003).
