
Figure 2.
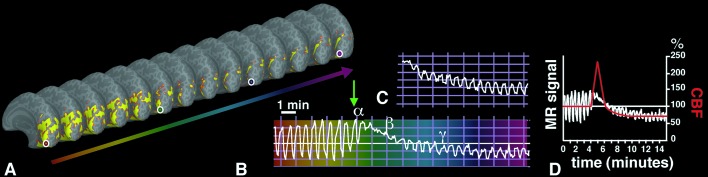
Time-dependent BOLD activity changes from a single region of interest in VI, acquired before and during episodes of either spontaneous (C) or induced (B) visual aura. (A) A series of anatomical images, including BOLD activity on “inflated” cortical hemispheres showing the medial bank (similar to a conventional midsagittal view). Images were sampled at 32-s intervals, showing the same region of interest (circles) in V1. (B) The MR signal perturbation over time from the circled region of interest; the perturbation is similar to that in Fig. 1B. Variations in time are color-coded (deep red to magenta), and the four colored circles match corresponding times within the V1 region of interest. The slice prescription failed to include a few mm in the most posterior part of the occipital pole in that induced attack, so activation is not revealed in any of these images. B shows that before the onset of the aura, the BOLD response to visual stimulation shows a normal, oscillating activation pattern. After the onset of aura (green arrow), the BOLD response showed a marked increase in mean level (α), a marked suppression to light modulation (β), followed by a partial recovery of the response to light modulation at decreased mean level (γ; −3% to −6%). (C) Data from a spontaneous attack (subject M.C.), captured ≈18 min after the onset of the visual symptoms affecting the right hemifield. The data represent the time course in left visual area V1, at an eccentricity of ≈20° of visual angle. (D) A superimposition of CBF changes seen in the rat during CSD (as described by Lauritzen et al. in ref. 46) with the MR signal data shown in A. Note that the timing of the hyperemia (3–4.5 min in CSD vs. 3.3 ± 1.9 min in migraine aura) is remarkably similar in these two quite different data sets. The amplitude of the hyperemia is different in the two conditions, presumably because of differences in the blood flow measurement techniques used (laser doppler versus BOLD) and the nonlinear relationship between blood flow and BOLD signal.