
Figure 1.
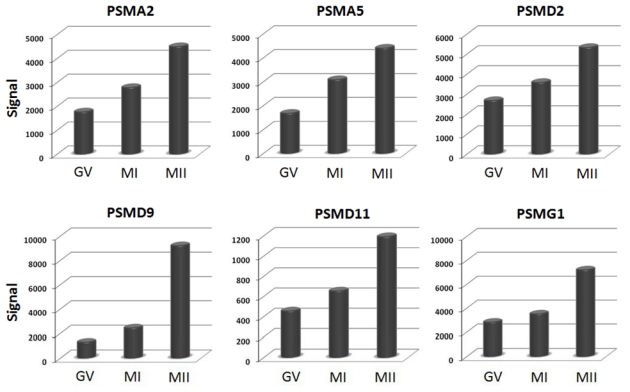
Upregulation of proteasome genes during oocyte maturation. Histograms show signal values of six proteasome genes (PSMA2, PSMA5, PSMD2, PSMD9, PSMD11 and PSMG1) in each stage of oocyte maturation. Gene expression is measured by pan-genomic HG-U133 Plus 2.0 Affymetrix oligonucleotides microarrays, and the signal intensity for each gene is shown on the Y-axis as arbitrary units determined by the GCOS 1.2 software (Affymetrix). GV; germinal vesicle; MI, metaphase I; MII, metaphase II.