
Figure 2.
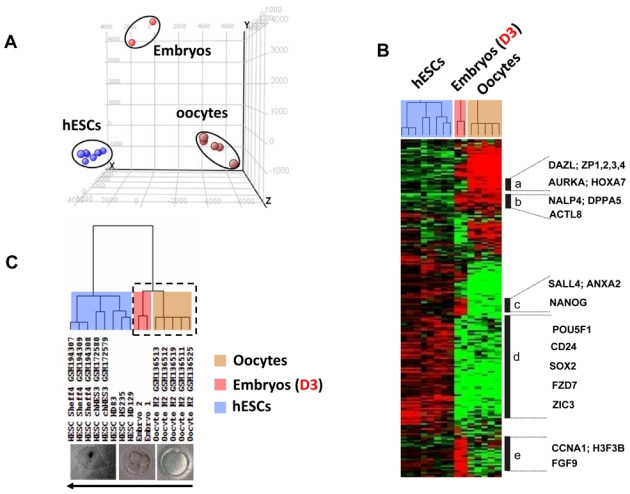
Principal component analysis (PCA) and hierarchical clustering of all samples from different developmental stages. (A) PCA distributes samples into a three-dimensional space based on the variances in gene expression; samples that have similar trends in their gene expression profiles will cluster together in the PCA plot. This analysis, using GeneSpring® software, resulted in a clear segregation of the fifteen replicated samples into three clusters, corresponding to human mature oocytes, human embryos, and hESCs. Each colored point represents a sample, characterized by the gene expression of all probe sets (54,675) on the Affymetrix HG U133 Plus 2 array. The first, second, and third principal components are displayed on the X-, Y- and Z-axes, respectively. (B) The expression signatures of samples were visualized by hierarchical clustering on the 10,000 probe sets with the highest variation coefficient. The colors indicate the relative expression levels of each gene, with red indicating an expression above median, green indicating expression under median and black representing median expression. Cluster (a) was a group of genes differentially overexpressed in oocytes, including DAZL, ZP1, ZP2, ZP3, ZP4, AURKA and HOXA7. Cluster (b) featured genes that were detected in both oocyte and embryo samples, such as the NALP4, DPPA5, and ACTL8. Cluster (c) grouped genes that were detected in both embryo and hESC samples, such as NANOG, SALL4, and ANXA2. Cluster (d) included genes differentially overexpressed in hESCs, such as POU5F1, CD24, SOX2, FZD7 and ZIC3. Cluster (e) assembled genes overexpressed in day-3 embryos, such as CCNA1, H3F3B and FGF9. (C) The dendogram shows that all replicates are clustered by their appropriate stage. All the replicate samples of the hESC group self-cluster into one branch. Both oocyte and embryo samples self-cluster into another branch (dotted box) that further divides into two major sub-branches and into which all the replicates from oocytes and embryos self-cluster.