

Abstract
Calcium-binding protein 1 (CaBP1), a neuron-specific member of the calmodulin (CaM) superfamily, regulates the Ca2+-dependent activity of inositol 1,4,5-triphosphate receptors (InsP3Rs) and various voltage-gated Ca2+ channels. Here, we present the NMR structure of full-length CaBP1 with Ca2+ bound at the first, third, and fourth EF-hands. A total of 1250 nuclear Overhauser effect distance measurements and 70 residual dipolar coupling restraints define the overall main chain structure with a root-mean-squared deviation of 0.54 Å (N-domain) and 0.48 Å (C-domain). The first 18 residues from the N-terminus in CaBP1 (located upstream of the first EF-hand) are structurally disordered and solvent exposed. The Ca2+-saturated CaBP1 structure contains two independent domains separated by a flexible central linker similar to that in calmodulin and troponin C. The N-domain structure of CaBP1 contains two EF-hands (EF1 and EF2), both in a closed conformation [interhelical angles = 129° (EF1) and 142° (EF2)]. The C-domain contains EF3 and EF4 in the familiar Ca2+-bound open conformation [interhelical angles = 105° (EF3) and 91° (EF4)]. Surprisingly, the N-domain adopts the same closed conformation in the presence or absence of Ca2+ bound at EF1. The Ca2+-bound closed conformation of EF1 is reminiscent of Ca2+-bound EF-hands in a closed conformation found in cardiac troponin C and calpain. We propose that the Ca2+-bound closed conformation of EF1 in CaBP1 might undergo an induced-fit opening only in the presence of a specific target protein, and thus may help explain the highly specialized target binding by CaBP1.
Keywords: CaBP1; NMR; calcium; neuronal calcium sensor; inositol 1,4,5-trisphosphate receptor; calmodulin; EF-hand; myristoylation
Introduction
Excitation of neurons leads to the generation of cytosolic calcium signals that are critical for activating neurotransmitter release and triggering alterations in neuronal cell function.1,2 Neuronal calcium-binding proteins (CaBP1–5)3–5 are a subclass of the CaM superfamily6 that regulates specific Ca2+ channel targets in the brain and retina. Multiple isoforms of CaBPs are localized in different neuronal cell types7–10 and perform specialized roles in sensory transduction and disease processes.11 CaBP1 is the best characterized family member and has been shown to regulate inositol 1,4,5-triphosphate receptors (InsP3Rs),12,13 P/Q-type voltage-gated Ca2+ channels,14 L-type Ca2+ channels,15–17 and the transient receptor potential channel (TRPC5).18 Early studies suggested that only the C-terminal half of CaBP1 (EF3 and EF4) also called calbrain19 might be sufficient to bind and regulate InsP3Rs.20 By contrast, the full-length CaBP1 (including the N-terminal myristoyl group) is necessary for membrane-targeting21 and regulation of L-type voltage-gated Ca2+ channels.22 Thus, CaBP1 appears to interact differently with the various Ca2+ channel targets and therefore, detailed structures are needed to understand their complex regulatory mechanisms.
CaBP1 is structurally similar to CaM with nearly 42% amino acid sequence identity. CaBP1 contains four EF hands: EF1 and EF2 form the N-domain, and EF3 and EF4 form a C-domain. EF3 and EF4 are both Ca2+ sensor sites that bind Ca2+ with relatively high affinity (Kd = 2 μM) and selectivity over Mg2+.23 By contrast, the metal-binding properties of the N-domain in CaBP1 are quite unique. The EF1 of CaBP1 binds Ca2+ with relatively low affinity (Kd = 50–100 μM) and with little or no selectivity over Mg2+ (Kd = 300 μM for Mg2+).23 The low affinity Ca2+ binding to EF1 might be physiologically relevant in neuronal dendrites that can have locally high Ca2+ levels24 or in neurons that generate repetitive Ca2+ spikes and/or waves.25,26 EF2 does not bind Ca2+ or Mg2+, because it contains a glycine at the 5-position of the binding loop that prevents Ca2+ binding. Another distinguishing feature of CaBP1 is that it contains a consensus site for N-terminal myristoylation and four extra residues in the central interdomain linker. NMR structures are known for the full-length Mg2+-bound CaBP1 and a C-domain fragment (residues 96–167) in both the Ca2+-free and the Ca2+-bound states.20 There is also a crystal structure of half-saturated CaBP1 (Ca2+ bound only at EF3 and EF4).22 The structure of full-length CaBP1 in the Ca2+-saturated state was not previously studied.
We report here a high resolution NMR structure of full-length CaBP1 with Ca2+-bound at EF1, EF3, and EF4. This Ca2+-saturated state of CaBP1 contains two noninteracting and independent domains similar to that described previously for Mg2+-bound CaBP1.20 The N-domain contains Ca2+ bound at EF1 but not at EF2; the helices of EF1 and EF2 form a four helix bundle and adopt a closed conformation. The C-domain contains EF3 and EF4 in the familiar Ca2+-bound open conformation like that seen for CaM. We propose that the unusual Ca2+-bound closed conformation of EF1 could play a role in preventing the binding of unwanted target proteins and may increase the specificity of target recognition.
Results
NMR spectroscopy of Ca2+-saturated CaBP1
15N–1H HSQC NMR spectrum of full-length CaBP1 in the Ca2+-saturated state exhibits the expected number of highly dispersed peaks, indicating that the protein adopts a stable three-dimensional fold.23 The first 18 residues from the N-terminus exhibited weak NMR signals that could not be assigned. The remaining residues (19–167) exhibited strong NMR peaks, whose sequence-specific assignments were described previously27 (BMRB No. 16862). Three downfield shifted amide proton resonances at ∼10.5 ppm in the 15N–1H HSQC spectrum of Ca2+-saturated CaBP1 are assigned to Gly40, Gly117, and Gly154 that correspond to the conserved glycine at the 6-position in the binding loops of EF1, EF3, and EF4. The conserved Gly residue at the 6-position has a downfield shifted amide proton chemical shift only when Ca2+ or Mg2+ binds to the EF-hand loop. Thus, the three downfield shifted amide resonances assigned to Gly40, Gly117, and Gly154 in the presence of saturating Ca2+ verify that Ca2+ is bound at EF1, EF3, and EF4, consistent with three Ca2+ bound to CaBP1 at saturation.23 By contrast, Gly76 (6-position in EF2) has a relatively low value for its amide proton chemical shift (8.15 ppm), which is further evidence that Ca2+ is not bound to EF2 in CaBP1 under saturating conditions.
CaBP1 has two independent domains
The first step in the NMR structural analysis of Ca2+-saturated CaBP1 was to identify, whether the four EF-hands combine to form two independently folded domains: N-domain (EF1 and EF2) versus C-domain (EF3 and EF4) like what is seen in CaM.28 Alternatively, the four EF-hands might interact to form a single globular structure like what is observed in recoverin,29,30 NCS-1,31,32 CIB1,33 or the compact oligomeric crystal structure of half-saturated CaBP1.22 First, we analyzed NOESY-HSQC spectra of Ca2+-saturated CaBP1 and were unable to detect any nuclear Overhauser effect (NOE)-based contacts between the two domains, consistent with the Ca2+-saturated protein having noninteracting domains.
The most convincing evidence for two independent domains is demonstrated by analyzing NMR spectra of individual domain fragments of Ca2+-saturated CaBP1: N-domain (residues 1–91) and C-domain (96–167). The 1H–15N-HSQC spectra of the domain constructs (Fig. 1) indicate that each domain is separately folded without having the other domain present. A spectral comparison of full-length CaBP1 versus the domain fragments indicates that they have very similar chemical shifts except for residues in unstructured regions. Hence, the structures of the individual domain fragments closely resemble their structure in the full-length protein.
Figure 1.
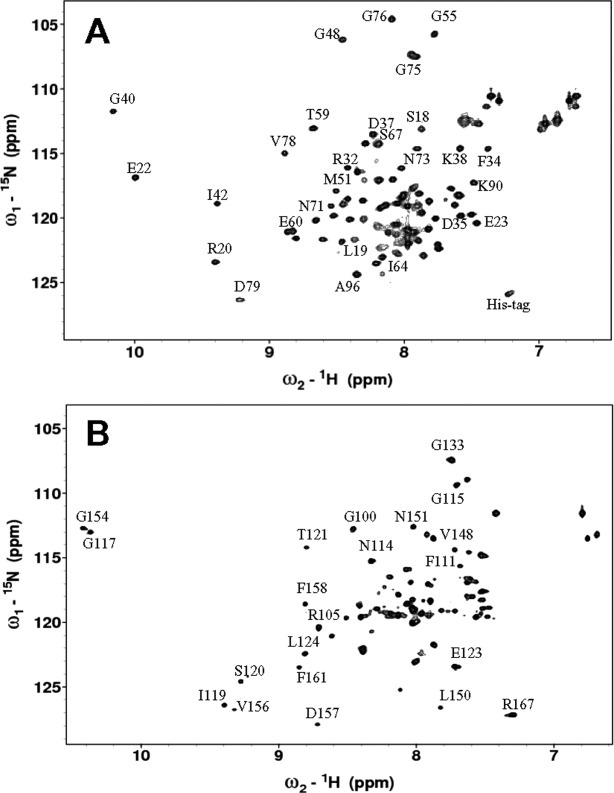
15N–1H HSQC spectra of Ca2+-saturated CaBP1 for the N-domain fragment (residues 1–91) (A) and C-domain fragment (residues 96–167) (B).
Lastly, we examined the backbone flexibility of the central domain linker region (residues 92–98). In Figure 2(A), {1H}–15N NOE measurements indicate relatively low heteronuclear NOE values (<0.6) for residues in the central linker region, suggesting that CaBP1 does indeed contain a flexible interdomain linker. By contrast, much higher heteronuclear NOE values (∼0.8), moderate 15N transverse relaxation rates (average R2 = 15.3 s−1), and uniform 15N longitudinal relaxation rates (average R1 = 1.75 s−1) are found for residues in each domain, indicating the two domains are separately folded like the two lobes of CaM.28 Thus, Ca2+-saturated CaBP1 has two independent domains separated by a central flexible linker.
Figure 2.
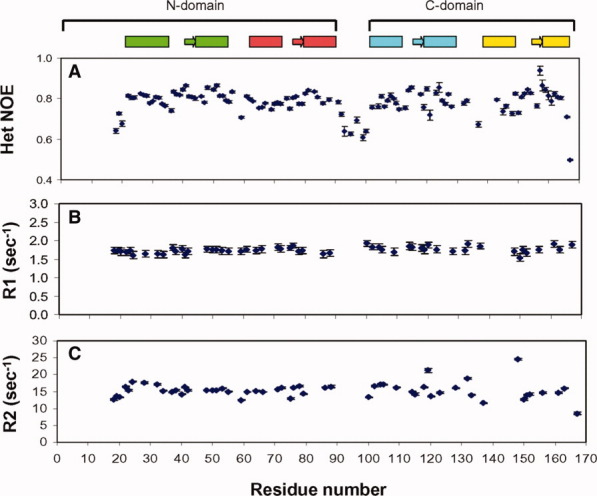
15N NMR relaxation data showing {1H}–15N NOE (A), 15N longitudinal relaxation rate (B), and 15N transverse relaxation rate (C) for Ca2+-saturated CaBP1. A schematic representation of the secondary structure is shown at the top with α-helices and β-strands indicated by boxes and arrows, respectively.
NMR-derived structures of Ca2+-saturated CaBP1
Sequence-specific NMR assignments for Ca2+-saturated CaBP1 have been described previously27 (BMRB No. 16862). On the basis of the NMR assignments, NMR-derived structures of Ca2+-saturated CaBP1 were initially calculated using NOE distances, hydrogen bonds, and dihedral angle restraints as input for a restrained molecular dynamics structure calculation as described in “Materials and Methods” section. Preliminary structures calculated by simulated annealing were then refined using residual dipolar coupling (RDC) restraints (DN–HN; 47 and 23 RDCs for N-domain and C-domain) using Xplor-NIH.34 The RDCs from each domain were analyzed separately, and the final average residual dipolar coupling magnitude and rhombicity are 12.88(±0.63) Hz and 0.23(±0.05) (respectively, for the N-domain) and 19.88(±1.22) Hz and 0.24(±0.07) (respectively, for the C-domain), indicating that the two domains align with different orientations, consistent with the highly flexible interdomain linker observed in Figure 2. Table I summarizes the structure statistics for the 15 lowest energy conformers. The calculated structures were validated using PROCHECK, which shows that 88.9% of N-domain residues and 82.0% of C-domain residues belong to the most favorable region on the Ramachandran plot. In addition, a comparison of residual dipolar couplings (withheld from the refinement) with corresponding RDC values back calculated from the NMR-derived structures was used to assess the quality of structures (Fig. 3). The subset of NH RDCs withheld from the structure refinement correlates well with the NH RDCs back calculated from the refined structure of CaBP1, resulting in Q-free = 0.18/R-free = 0.98 (N-domain) and Q-free = 0.12/R-free = 0.99 (C-domain). For additional cross-validation, C′–Ca RDCs were measured in the same medium. The C′–Ca RDCs back calculated from the refined structure were correlated with C′–Ca RDCs measured with Q-free = 0.36/R-free = 0.93 (N-domain) and Q-free = 0.34/R-free = 0.95 (C-domain).
Table I.
Structural Statistics for the Ensemble Structures of CaBP1
| Ca2+ bound N-domain | Ca2+ bound C-domain | |
|---|---|---|
| Number of total experiment restraints | 893 | 701 |
| Intra NOE restraints | 218 | 179 |
| Medium NOE restraints | 332 | 241 |
| Long NOE restraints | 154 | 126 |
| Hydrogen bond restraints | 48 | 50 |
| Dihedral angle restraints | 94 | 82 |
| N-H residual dipolar restraints | 47 | 23 |
| RMSD from dipolar coupling restraints (Hz) | 0.119 ± 0.040 | 0.064 ± 0.019 |
| RMSD from ideal geometry | ||
| Bond length (Å) | 0.003 ± 0.001 | 0.002 ± 0.000 |
| Bond angle (°) | 0.424 ± 0.026 | 0.358 ± 0.013 |
| Impropers (°) | 0.372 ± 0.036 | 0.245 ± 0.015 |
| RMSD from average structure (Å) | ||
| Backbone | 0.54 ± 0.100 | 0.48 ± 0.087 |
| Heavy | 1.24 ± 0.107 | 1.28 ± 0.093 |
| Ramachandran analysis (%) | ||
| Most favored regions | 88.9 | 82.0 |
| Allowed regions | 11.1 | 18.0 |
| Disallowed regions | 0.0 | 0.0 |
Figure 3.
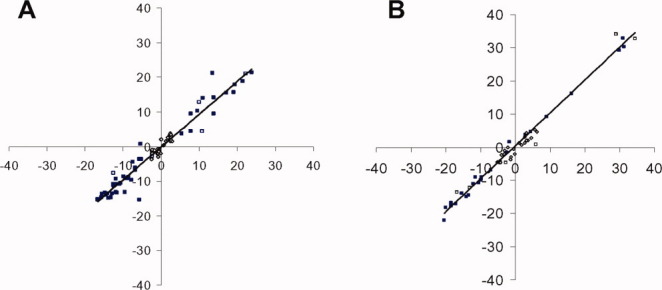
Correlation between experimentally measured RDC values and back-calculated RDC values from Ca2+ bound CaBP1 N-domain (A) and C-domain (B). The NH RDCs used for structure calculation (47/23 RDCs), the subset of NH RDCs withheld from the structure calculation (6/6 RDCs), and C′−Ca RDCs (30/24 RDCs) were all used to calculate the overall Q-factor and R-factor. For the cross-validation, the subset of NH RDCs (6/6 RDCs) and C′–Ca RDCs (30/24 RDCs) was used to calculate the free Q-factor and R-factor. [Color figure can be viewed in the online issue, which is available at wileyonlinelibrary.com.]
The final NMR-derived structures (refined by RDCs) of Ca2+-saturated CaBP1 are illustrated in Figure 4 and summarized in Table I. The 15 lowest energy conformers are superimposed [Fig. 4(A)] and have an overall main chain root-mean-square deviation (RMSD) of 0.54 Å (N-domain) and 0.48 Å (C-domain). The Ca2+-saturated CaBP1 structure contains a total of eight α-helices and four β-strands: α1(residues 22–34), α2(residues 44–54), α3(residues 61–70), α4(residues 80–88), α5(residues 101–111), α6(residues 121–130), α7(residues 140–147), α8(residues 158–165), β1(residues 41–43), β2(residues 77–79), β3(residues 118–120), and β4(residues 155–157). CaBP1 contains two domains comprising four EF hands: EF1 (green, residues 22–55) and EF2 (red, residues 61-91) are linked and form the N-domain; EF3 (cyan, residues 101–130) and EF4 (yellow, residues 140–167) form the C-domain. The extent of Ca2+-induced conformational changes in each EF-hand is typically quantified by the interhelical angle as defined by35 that ranges from ∼135° (Ca2+-free closed form) to ∼90° (Ca2+-bound open form). The interhelical angles for the EF-hands in Ca2+-bound CaBP1 are 128.7° (EF1), 142.5° (EF2), 105.2° (EF3), and 90.9° (EF4; see Table II). The structures of EF3 and EF4 in the Ca2+ bound C-domain of full-length CaBP1 both adopt the familiar Ca2+-bound open conformation refined by the RDC data. The overall RMSD is 0.6 and 1 Å when comparing the Ca2+-bound C-domain structure from full-length CaBP1 (this study) with the C-domain fragment20 and half-saturated crystal structure, respectively.
Figure 4.
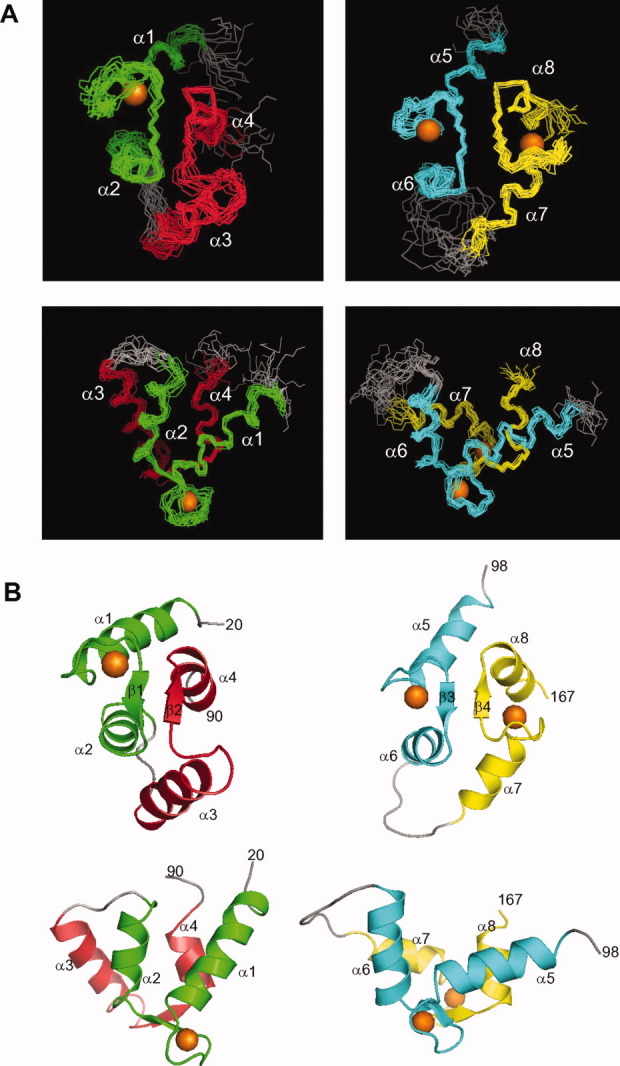
Main chain structures of Ca2+-saturated CaBP1 determined by NMR. Superposition of the 15 lowest energy structures (A) and ribbon representations of the energy-minimized average structure (B) are illustrated for the N-domain (left) and C-domain (right). N-terminal residues (1–19) are unstructured and not shown. EF-hands are highlighted in color. Orange spheres represent bound Ca2+. Protein databank accession nos. 2LAN and 2LAP.
Table II.
Interhelical Angles of the EF-Hands in CaM, CaBP1, and cTnC
| Interhelical angles (°) | ||||
|---|---|---|---|---|
| EF1 | EF2 | EF3 | EF4 | |
| Proteins | α1–α2 | α3–α4 | α5–α6 | α7–α8 |
| CaBP1 (1Ca2+/2Ca2+) | 128.7 | 142.5 | 105.2 | 90.9 |
| CaBP1 (1Mg2+/1Mg2+) | 126.8 | 140.2 | 140.1 | 126.2 |
| apo-CaM (0Ca2+/0Ca2+) | 130.9 | 130.8 | 139.5 | 126.0 |
| CaM (2Ca2+/2Ca2+) | 103.8 | 101.0 | 101.0 | 101.0 |
| cTnC (1Ca2+/2Ca2+) | 144.0 | 110.3 | 116.2 | 121.8 |
| cNTnC-cTnI (1Ca2+) | 105.7 | 88.5 | ||
Residues in the helices are as follows: Mg2+ bound CaBP1 (PDB code 2K7B for N-domain and 2K7C for C-domain) and Ca2+ bound CaBP1: (α1) 22-34, (α2) 45-54, (α3) 61-70, (α4) 80-88, (α5) 101-110, (α6) 121-130, (α7)141-147, (α8)158-165; apo-CaM (PDB code 1DMO) and Ca2+ bound CaM(PDB code 1J7P): (α1) 6-18, (α2) 29-38, (α3) 45-55, (α4) 65-75, (α5) 82-90, (α6) 103-112, (α7) 118-127, (α8)137-143; Ca2+ bound cTnC (PDB code 2CTN for N-domain and 3CTN for C-domain) and Ca2+bound cNTnC-cTnI complex(PDB code 1MXL):(α1) 14-27, (α2) 41-48, (α3) 54-62, (α4) 74-84, (α5) 95-103, (α6) 114-123, (α7) 130-140, (α8)150-158; Interhelical angles were computed by INTERHLX.
The structure of the Ca2+ bound N-domain of CaBP1 adopts a closed conformation with Ca2+ bound at EF1 and no metal bound at EF2. The interhelical angle of Ca2+-bound EF1 (128.7°) is slightly greater (and hence slightly more closed) than that of Mg2+-bound EF1 (126.8°)20 or Ca2+-free EF1 (127°).22 The helices of EF1 and EF2 in the Ca2+ bound N-domain form a 4-helix bundle (Fig. 4) that closely resembles the “closed” conformation observed previously for the Mg2+-bound N-domain,20 but is quite different from the Ca2+-free N-domain observed in the crystal structure. The main difference between the Ca2+-free and Ca2+-bound N-domain is the relative orientation of EF1 and EF2 (Supporting Information, Fig. S2). In the Ca2+-free N-domain, the two antiparallel helices of EF1(α1/α2) are nearly perpendicular to the corresponding helices of EF2(α3/α4). In the Ca2+-bound N-domain, the helices of EF1 become more parallel to those of EF2. Thus, divalent metal binding to EF1 (either Ca2+ or Mg2+) causes a 90° reorientation between EF1 and EF2 that enables β-sheet formation to connect the two EF-hands (Supporting Information, Fig. S2). The overall RMSD between the Ca2+-free and Ca2+-bound N-domain structures is 2.5 Å, whereas the RMSD between the Mg2+-bound and Ca2+-bound N-domain structures is only 0.54 Å.
A surface representation of Ca2+-saturated CaBP1 is illustrated in Figure 5. The highly charged N-domain forms an exposed patch of basic residues (R28, R32, K36, and R45) flanked by negatively charged residues in the EF-hand loops. These exposed basic residues might play a role in forming electrostatic contacts with specific target proteins. The Ca2+-bound N-domain has only a few exposed hydrophobic residues (M54, M57, M61, and L91) very similar to that of the Ca2+-free N-domain. By contrast, the Ca2+ bound C-domain exhibits an extensive solvent-exposed hydrophobic surface (surface area of 584.97 Å2) lined by exposed residues, F111, M128, L131, L132, I144, V148, M164, and M165 (highlighted yellow in Fig. 5). The exposure of nonconserved hydrophobic residues (L132, I144, and V148) may play a role in target recognition by forming hydrophobic contacts with specific target proteins.
Figure 5.
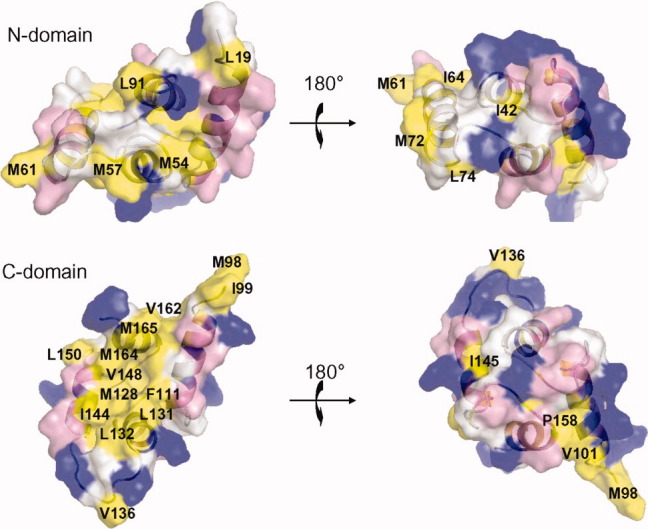
Space-filling representation of Ca2+-saturated CaBP1 illustrating the N-domain (top) and C-domain (bottom). Acidic residues (Asp and Glu), basic residues (Arg, His, and Lys), and hydrophobic residues (Ile, Leu, Phe, Met, and Val) are colored red, blue, and yellow, respectively.
Previous studies suggested that Ca2+-saturated CaBP1 may form a dimer under NMR conditions.23 Indeed, our 15N NMR relaxation analysis (R1 and R2) of CaBP1 [Figs. 2(B,C)] suggests an average rotational correlation time of ∼9 ns (between that expected for a protein monomer and dimer) that decreased somewhat when the protein concentration was lowered 10-fold. But, we did not observe any significant chemical shift changes in NMR spectra recorded as a function of protein concentration (50 μM to 1 mM). Also, intermolecular NOEs could not be detected in 13C-filtered NOESY-HMQC spectra of CaBP1 recorded from a mixed labeled sample. Thus, the CaBP1 monomer–dimer equilibrium may have an exchange rate that is faster than the chemical shift time scale, which might explain why the dimer interface cannot be resolved by NMR. Such fast exchange kinetics and hence low affinity for dimerization is not likely to be physiologically relevant and was not characterized further. We also note that the oligmerization of CaBP1 observed in the recent crystal structure22 clearly does not occur in solution under physiological conditions.
Ca2+-dependent binding of CaBP1 to ANS fluorophore
To further test whether the Ca2+-bound N-domain adopts a closed conformation, we recorded fluorescence emission spectra of ANS (8-anilino-1-naphthalene-sulfonic acid) in the presence and absence of CaBP1. The ANS emission spectrum typically shows a blue spectral shift with increased intensity when ANS binds to a hydrophobic site on a protein. Fluorescence spectra of ANS bound to a CaBP1 C-domain fragment (residues 96–167) show the characteristic Ca2+-induced blue shift and markedly increased intensity, consistent with ANS binding to the exposed hydrophobic patch in the Ca2+-bound C-domain (Supporting Information, Fig. S1). By contrast, fluorescence spectra of ANS are almost unaffected by the presence of the CaBP1 N-domain fragment (residues 1-91) in either the presence or the absence of Ca2+ (Supporting Information, Fig. S1). Hence, the CaBP1 N-domain shows very weak binding to ANS even in the Ca2+-saturated state, consistent with a closed conformation for the Ca2+ bound N-domain.
Discussion
In this study, we determined the NMR solution structure of full-length, Ca2+-saturated CaBP1 with Ca2+ bound at EF1, EF3, and EF4. The first 18 residues from the N-terminus (upstream of EF1) are solvent exposed and structurally disordered, consistent with CaBP1 having an exposed N-terminal myristoyl group for membrane-targeting as described previously for recoverin30 and NCS-1.32 The overall structure of CaBP1 in solution contains two independent domains separated by a flexible linker like that observed for CaM28 and TnC.36 This is in sharp contrast to the recent crystal structure of half-saturated CaBP122 that contains a more compact conformation in which the side-chain carboxylate of E94 in the central linker forms contacts with N-domain residues. No such interaction could be seen in the NMR solution structure, which instead contains an unstructured and flexible domain linker (Fig. 2). The compact conformation in the crystal structure is stabilized almost entirely by intermolecular interactions because of crystal packing, which might explain why this compact conformation is not stable in solution at physiological temperatures. The NMR structure of the Ca2+-saturated C-domain of CaBP1 adopts an “open” conformation (Fig. 4) with an exposed hydrophobic patch (Fig. 5) very similar to that in the crystal structure (RMSD = 1 Å). By contrast, the structure of the Ca2+ bound N-domain of CaBP1 adopts a closed conformation similar to that of the Mg2+-bound N-domain.20 Therefore, the N-domain does not undergo the classic Ca2+ induced closed-to-open transition seen in other EF-hand calcium sensor proteins like CaM,6,37 skeletal TnC,38 recoverin,30,39 and many others. The lack of any Ca2+ binding to CaBP1 at EF2 along with the low affinity Ca2+ binding at EF1 might explain why Ca2+ binding to the N-domain is not sufficient to drive a closed-to-open transition. As a result, the CaBP1 N-domain remains in a closed conformation in both the Ca2+-free and the Ca2+-bound states. A Ca2+ bound, closed EF-hand has only been reported for two other EF-hand calcium sensors [calpain40 and cardiac troponin C (cTnC)41] and in the pseudo-EF-hand of S100 proteins (calcyclin42 and S100B43).
The two independent domains of CaBP1 have very different structural and functional roles in regulating Ca2+ channel targets. The structure of the CaBP1 C-domain is quite similar to that of CaM, and thus, the C-domain alone (also called calbrain19) exhibits Ca2+-dependent and tight binding to particular CaM-binding motifs in L-type Ca2+ channels22 and the N-terminal ligand-binding domain of InsP3Rs.13,20 By contrast, the CaBP1 N-domain alone does not bind to these same sites. Nevertheless, the CaBP1 N-domain is essential for membrane-targeting21 and calcium-dependent facilitation of L-type Ca2+ channels,22 suggesting that the N-domain serves a regulatory function. We suggest that the two domains of CaBP1 may interact with two separate sites on Ca2+ channel targets (Fig. 6), analogous to the CaM bipartite interaction with voltage-gated Ca2+ channels.44,45 In this context, the CaBP1 C-domain would serve as a Ca2+-dependent anchor by binding to an IQ-motif in L-type Ca2+ channels22 or the ligand-binding domain in InsP3Rs.13,20 This initial anchoring by the CaBP1 C-domain then would position the myristoylated N-domain in close proximity to bind to a separate site in the channel or perhaps bind to an auxiliary protein. This scenario would predict that the CaBP1 N-domain must somehow interact with a target protein (Fig. 6).
Figure 6.
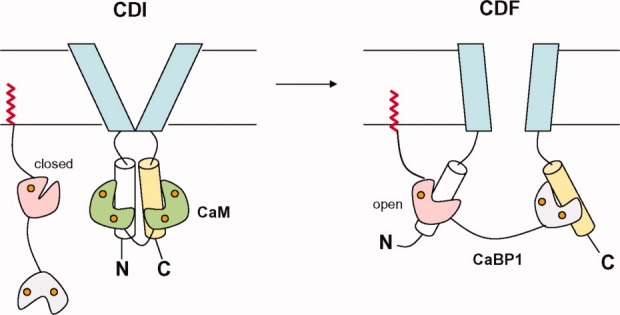
Schematic model showing possible structural interactions of CaM and CaBP1 with voltage-gated Ca2+ channels during calcium-dependent inhibition (CDI, left panel) and calcium-dependent facilitation (CDF, right panel). The CaBP1 C-domain (gray) and CaM C-domain (green) both compete to interact with the CaV1.2 IQ-motif (yellow) in the C-terminal cytosolic domain. The CaBP1 N-domain (pink) switches from a closed to open conformation upon binding to a separate helical segment in the channel that may play a role in CDF as described by Ref.22. Bound Ca2+ (orange), N-terminal myristoyl group (red), CaM (green), and transmembrane channel domain (light blue) are highlighted.
CaBP1 is structurally analogous to cardiac troponin C (cTnC),41 and both may recognize targets by a similar induced-fit mechanism. The C-domain of cTnC undergoes a Ca2+-induced closed-to-open transition,41,46 but the Ca2+-bound N-domain of cTnC remains in a closed conformation like that of CaBP1. The cTnC N-domain contains one Ca2+ bound at EF2 (EF1 is unoccupied), reminiscent of the CaBP1 N-domain that contains Ca2+ bound only at EF1. The Ca2+ bound N-domain of cTnC converts into an open conformation only upon binding to cTnI.47 By analogy to cTnC, we suggest that the Ca2+ bound N-domain of CaBP1 may undergo a similar “induced-fit” closed-to-open transition only in the presence of a specific target protein (Fig. 6). The induced-fit opening of the CaBP1 N-domain may explain why CaBP1 exhibits such highly specific target binding, compared with calmodulin that binds to many different protein targets.
Voltage-gated Ca2+ channels are negatively regulated by CaM44,45,48 and positively regulated by CaBP115–17,22 to fine tune the Ca2+ channel activity in neurons. A schematic model of Ca2+ channel activity differentially regulated by CaM and CaBP1 is shown in Figure 6. During calcium-dependent inhibition (CDI) of L-type Ca2+ channels,49 CaM binds to the channel instead of CaBP1, and the two lobes of CaM bind to separate sites to promote channel closure44,45 (Fig. 6, right panel). The level of CaM in stimulated neurons may be higher than that of CaBP1 during CDI,16 which could explain how CaM might displace CaBP1 from the channel in a closed conformation (Fig. 6, left panel). During calcium-dependent facilitation (CDF) of L-type channels,22 CaBP1 is proposed to bind to L-type channels in place of CaM, and the CaBP1 N-domain is then predicted to switch into an active open conformation to promote channel opening as depicted in Figure 6 (right panel). We cannot rule out the possibility that the Ca2+-bound closed conformation of the CaBP1 N-domain might also interact with the channel or other protein targets. However, such a target interaction with a closed EF-hand structure so far has not been reported and seems unlikely. Future studies are needed to identify specific binding partner proteins and/or particular sites on Ca2+ channels that bind specifically with the CaBP1 N-domain and then ultimately determine the atomic-level structure of CaBP1 bound to Ca2+ channel targets.
Materials and Methods
Sample preparation
All NMR experiments were performed on a small splice-variant of human s-CaBP1 referred to in this study as CaBP1. The recombinant CaBP1 protein was cloned into a pET3b vector and expressed in Escherichia coli BL21(DE3) cells as described previously.23 Uniformly 13C/15N-labeled protein expression was induced by the addition of 0.5 mM IPTG at 37°C in M9 minimal medium containing 15NH4Cl and U-13C glucose. Cells obtained from M9 cultures were disrupted by sonication. The cell lysate was centrifuged, and the supernatant was loaded onto a Phenyl-Sepharose 4B column (Amersham Biosciences), and CaBP1 protein was purified as described.23 The protein purity was greater than 95% as confirmed by SDS-PAGE.
NMR spectroscopy
Samples for NMR analysis were prepared by dissolving 13C/15N-labeled CaBP1 (1 mM) in 0.3 mL of a 90/10% H2O/D2O or 100% D2O with 10 mM [2H11] Tris (pH = 7.4), 1 mM 2H-labeled dithiothreitol and 5 mM CaCl2. All NMR experiments were recorded at 37°C on a Bruker Avance 600 or 800 MHz spectrometers with triple-resonance cryogenic probe. Backbone and side-chain chemical shift assignment were accomplished with 15N-HSQC, HNCO, CACBCONH, NHCACB, HBHACONH, 15N-HSQC-TOCSY, and HCCH-TOCSY spectra. 1H chemical shift assignments of aromatic side chains were based on HBCBCGCDHD, 1H–1H TOCSY, and 1H–1H NOESY spectra. Stereospecific assignments of valine and leucine methyl groups were obtained by performing 13C-CT-HSQC experiments on a protein sample generated by growing bacterial cells in M9 medium containing 10% 13C-labeled glucose and 90% unlabeled glucose. H–15N residual dipolar coupling constants (DNH) were measured using a 15N-labeled protein sample (∼0.3 mM) containing 10 mg/mL Pf1 phage (Asla Biotech) using 2D IPAP (inphase/antiphase) 1H–15N HSQC experiment.50 For the cross-validation, C′–Ca residual dipolar coupling constants (DC′–Ca) were measured in 13C/15N protein sample (∼1 mM) containing 10 mg/mL Pf1 phage by 3D HNCO-J-IPAP experiment.51
Measurement of 15N longitudinal relaxation rate R1, transverse relaxation rate R2, and 1H–15N NOE were obtained as previously described52 at 60.82 MHz 15N resonance frequency. The heteronuclear NOEs were obtained as a ratio of HSQC cross-peak intensities measured with and without steady-state saturation of proton magnetization.52 Standard deviations in NOE measurements were estimated from the signal-to-noise ratio. Relaxation delays for R1 experiments were 0.016, 0.04, 0.08, 0.16, and 0.32 s, and for R2 experiments 8, 16, 24, 32, 48, 64, and 80 ms. Uncertainty of R1 and R2 values were determined by Monte-Carlo error simulation. The global correlation time τc was calculated using 54 residues after excluding residues for which the resonance frequencies overlap. All NMR data were processed using NMR Pipe software package53 and analyzed using SPARKY(T.D. Goddard et al., University of California, San Francisco).
Structure calculation and validation
Structures of CaBP1 were calculated by Xplor-NIH 2.2334 using two stage simulated annealing protocols. In the first stage, dihedral angle restraints derived from TALOS,54 NOE distance restraints, hydrogen bond distance restraints, distance restraints involving Ca2+ bound to EF-hand loop residues 1, 3, 5, 7, and 12 in EF3 and EF4 (as described by Ref.20), and Ca2+ bound to loop residues 1, 3, 5, and 7 in EF1 were used to calculate ensemble model structures using the YASAP protocol.55 For EF1, the loop residue at the 12-position (D46) was verified to not contact the bound Ca2+ based on the D46A mutation that has almost no effect on Ca2+ binding.20 In a separate second stage calculation, the preliminary model structures (calculated by simulated annealing) were refined against the residual dipolar coupling (DN–H) restraints as described by Ref.56. Initial residual dipolar coupling magnitude and rhombicity were calculated by fitting the measured residual dipolar couplings to the calculated structure using the PALES program.57 After refinement, the 15 lowest energy structures (from a total of 150) were selected and analyzed. The NMR-derived structures of CaBP1 were assessed by PROCHECK and also validated by comparing the correlation between experimentally measured RDCs and back-calculated RDCs from our structure using the PALES program. A subset of NH RDCs (6 RDCs for N-domain and 6 RDCs for C-domain), which were withheld from the structure calculation and C′Ca RDCs (30 RDCs for N-domain and 24 RDCs for C-domain), were used to calculate the free Q-factor and free Pearson's R-factor. The NMR-derived ensemble structures of CaBP1 were deposited in the Protein Data Bank, with accession codes 2LAN (N-domain) and 2LAP (C-domain).
Fluorescence spectroscopy
ANS emission spectra were recorded at 25°C on Varian Cary Eclipse spectrofluorometer with excitation set at 370 nm, and emission was recorded from 400 to 600 nm. The excitation and emission slit width were 5 and 10nm, respectively. Samples contained 60 μM ANS, 60 μM protein, 10 mM Tris buffer (pH = 7.5), 1 mM dithiothreitol (DTT) with either 2 mM EDTA (apo-state), 5 mM MgCl2, or 5 mM CaCl2.
Acknowledgments
We are grateful to Dr. Jerry Dallas for help with NMR experiments, Dr. Frits Abildgaard for providing NMR pulse-sequence programs, and Frank Delaglio for writing computer software for NMR data processing and analysis.
Glossary
Abbreviations:
- CaBP1
calcium-binding protein 1
- CaM
calmodulin
- HSQC
heteronuclear single quantum correlation
- NMR
nuclear magnetic resonance
- NOE
nuclear Overhauser effect
- NOESY
nuclear Overhauser effect spectroscopy
- RDC
residual dipolar coupling
- RMSD
root-mean-square deviation
- TOCSY
total correlation spectroscopy
Supplementary material
References
- 1.Bennett MK. Ca2+ and the regulation of neurotransmitter secretion. Curr Opin Neurobiol. 1997;7:316–322. doi: 10.1016/s0959-4388(97)80058-x. [DOI] [PubMed] [Google Scholar]
- 2.Burgoyne RD, Morgan A. Ca2+ and secretory-vesicle dynamics. Trends Neurosci. 1995;18:191–196. doi: 10.1016/0166-2236(95)93900-i. [DOI] [PubMed] [Google Scholar]
- 3.Haeseleer F, Sokal I, Verlinde CL, Erdjument H, Tempst P, Pronin AN, Benovic JL, Fariss RN, Palczewski K. Five members of a novel Ca(2+)-binding protein (CABP) subfamily with similarity to calmodulin. J Biol Chem. 2000;275:1247–1260. doi: 10.1074/jbc.275.2.1247. [DOI] [PMC free article] [PubMed] [Google Scholar]
- 4.Haeseleer F, Imanishi Y, Sokal I, Filipek S, Palczewski K. Calcium-binding proteins: intracellular sensors from the calmodulin superfamily. Biochem Biophys Res Commun. 2002;290:615–623. doi: 10.1006/bbrc.2001.6228. [DOI] [PubMed] [Google Scholar]
- 5.Mikhaylova M, Sharma Y, Reissner C, Nagel F, Aravind P, Rajini B, Smalla KH, Gundelfinger ED, Kreutz MR. Neuronal Ca2+ signaling via caldendrin and calneurons. Biochim Biophys Acta. 2006;1763:1229–1237. doi: 10.1016/j.bbamcr.2006.08.047. [DOI] [PubMed] [Google Scholar]
- 6.Ikura M. Calcium binding and conformational response in EF-hand proteins. Trends Biochem Sci. 1996;21:14–17. [PubMed] [Google Scholar]
- 7.Haynes LP, Tepikin AV, Burgoyne RD. Calcium-binding protein 1 is an inhibitor of agonist-evoked, inositol 1,4,5-trisphosphate-mediated calcium signaling. J Biol Chem. 2004;279:547–555. doi: 10.1074/jbc.M309617200. [DOI] [PubMed] [Google Scholar]
- 8.Menger N, Seidenbecher CI, Gundelfinger ED, Kreutz MR. The cytoskeleton-associated neuronal calcium-binding protein caldendrin is expressed in a subset of amacrine, bipolar and ganglion cells of the rat retina. Cell Tissue Res. 1999;298:21–32. doi: 10.1007/s004419900060. [DOI] [PubMed] [Google Scholar]
- 9.Seidenbecher CI, Langnaese K, Sanmarti L, Boeckers TM, Smalla KH, Sabel BA, Garner CC, Gundelfinger ED, Kreutz MR. Caldendrin, a novel neuronal calcium-binding protein confined to the somato-dendritic compartment. J Biol Chem. 1998;273:21324–21331. doi: 10.1074/jbc.273.33.21324. [DOI] [PubMed] [Google Scholar]
- 10.Seidenbecher CI, Reissner C, Kreutz MR. Caldendrins in the inner retina. Adv Exp Med Biol. 2002;514:451–463. doi: 10.1007/978-1-4615-0121-3_27. [DOI] [PubMed] [Google Scholar]
- 11.Haeseleer F, Imanishi Y, Maeda T, Possin DE, Maeda A, Lee A, Reike F, Palczewski K. Essential role of Ca2+-binding protein 4, a Cav1.4 channel regulator, in photoreceptor synaptic function. Nat Neurosci. 2004;7:1079–1087. doi: 10.1038/nn1320. [DOI] [PMC free article] [PubMed] [Google Scholar]
- 12.Yang J, McBride S, Mak DO, Vardi N, Palczewski K, Haeseleer F, Foskett JK. Identification of a family of calcium sensors as protein ligands of inositol trisphosphate receptor Ca(2+) release channels. Proc Natl Acad Sci USA. 2002;99:7711–7716. doi: 10.1073/pnas.102006299. [DOI] [PMC free article] [PubMed] [Google Scholar]
- 13.Kasri NN, Holmes AM, Bultynck G, Parys JB, Bootman MD, Rietdorf K, Missiaen L, McDonald F, De Smedt H, Conway SJ, Holmes AB, Berridge MJ, Roderick HL. Regulation of InsP3 receptor activity by neuronal Ca2+-binding proteins. EMBO J. 2004;23:312–321. doi: 10.1038/sj.emboj.7600037. [DOI] [PMC free article] [PubMed] [Google Scholar]
- 14.Lee A, Westenbroek RE, Haeseleer F, Palczewski K, Scheuer T, Catterall WA. Differential modulation of Ca(v)2.1 channels by calmodulin and Ca2+-binding protein 1. Nat Neurosci. 2002;5:210–217. doi: 10.1038/nn805. [DOI] [PMC free article] [PubMed] [Google Scholar]
- 15.Zhou H, Kim SA, Kirk EA, Tippens AL, Sun H, Haeseleer F, Lee A. Ca2+-binding protein-1 facilitates and forms a postsynaptic complex with Cav1.2 (L-type) Ca2+ channels. J Neurosci. 2004;24:4698–4708. doi: 10.1523/JNEUROSCI.5523-03.2004. [DOI] [PMC free article] [PubMed] [Google Scholar]
- 16.Zhou H, Yu K, McCoy KL, Lee A. Molecular mechanism for divergent regulation of Cav1.2 Ca2+ channels by calmodulin and Ca2+-binding protein 1. J Biol Chem. 2005;280:29612–29619. doi: 10.1074/jbc.M504167200. [DOI] [PubMed] [Google Scholar]
- 17.Tippens AL, Lee A. Caldendrin, a neuron-specific modulator of Cav/1.2 (L-type) Ca2+ channels. J Biol Chem. 2007;282:8464–8473. doi: 10.1074/jbc.M611384200. [DOI] [PubMed] [Google Scholar]
- 18.Kinoshita-Kawada M, Tang J, Xiao R, Kaneko S, Foskett JK, Zhu MX. Inhibition of TRPC5 channels by Ca2+-binding protein 1 in Xenopus oocytes. Pflugers Arch. 2005;450:345–354. doi: 10.1007/s00424-005-1419-1. [DOI] [PubMed] [Google Scholar]
- 19.Yamaguchi K, Yamaguchi F, Miyamoto O, Sugimoto K, Konishi R, Hatase O, Tokuda M. Calbrain, a novel two EF-hand calcium-binding protein that suppresses Ca2+/calmodulin-dependent protein kinase II activity in the brain. J Biol Chem. 1999;274:3610–3616. doi: 10.1074/jbc.274.6.3610. [DOI] [PubMed] [Google Scholar]
- 20.Li C, Chan J, Haeseleer F, Mikoshiba K, Palczewski K, Ikura M, Ames JB. Structural insights into Ca2+-dependent regulation of inositol 1,4,5-trisphosphate receptors by CaBP1. J Biol Chem. 2009;284:2472–2481. doi: 10.1074/jbc.M806513200. [DOI] [PMC free article] [PubMed] [Google Scholar]
- 21.Few AP, Lautermilch NJ, Westenbroek RE, Scheuer T, Catterall WA. Differential regulation of CaV2.1 channels by calcium-binding protein 1 and visinin-like protein-2 requires N-terminal myristoylation. J Neurosci. 2005;25:7071–7080. doi: 10.1523/JNEUROSCI.0452-05.2005. [DOI] [PMC free article] [PubMed] [Google Scholar]
- 22.Findeisen F, Minor DL. Structural basis for the differential effects of CaBP1 and calmodulin on Ca(V)1.2 calcium-dependent inactivation. Structure. 2010;18:1617–1631. doi: 10.1016/j.str.2010.09.012. [DOI] [PMC free article] [PubMed] [Google Scholar]
- 23.Wingard JN, Chan J, Bosanac I, Haeseleer F, Palczewski K, Ikura M, Ames JB. Structural analysis of Mg2+ and Ca2+ binding to CaBP1, a neuron-specific regulator of calcium channels. J Biol Chem. 2005;280:37461–37470. doi: 10.1074/jbc.M508541200. [DOI] [PMC free article] [PubMed] [Google Scholar]
- 24.Larkum M, Watanabe S, Nakamura T, Lasser-Ross N, Ross WN. Synaptically activated Ca2+ waves in layer 2/3 and layer 5 rat neocortical pyramidal neurons. J Physiol. 2003;549:471–488. doi: 10.1113/jphysiol.2002.037614. [DOI] [PMC free article] [PubMed] [Google Scholar]
- 25.Meyer T, Stryer L. Calcium spiking. Annu Rev Biophys Biophys Chem. 1991;20:153–174. doi: 10.1146/annurev.bb.20.060191.001101. [DOI] [PubMed] [Google Scholar]
- 26.Ross WN, Nakamura T, Watanabe S, Larkum M, Lasser-Ross N. Synaptically activated Ca2+ release from internal stores in CNS neurons. Cell Mol Neurobiol. 2005;25:283–295. doi: 10.1007/s10571-005-3060-0. [DOI] [PMC free article] [PubMed] [Google Scholar]
- 27.Park S, Li C, Ames JB. 1H, 15N, and 13C chemical shift assignments of calcium-binding protein 1 with Ca2+ bound at EF1, EF3 and EF4. Biol NMN Assign. 2010;4:159–161. doi: 10.1007/s12104-010-9235-8. [DOI] [PMC free article] [PubMed] [Google Scholar]
- 28.Barbato G, Ikura M, Kay LE, Pastor RW, Bax A. Backbone dynamics of calmodulin studied by 15N relaxation using inverse detected two-dimensional NMR spectroscopy: the central helix is flexible. Biochemistry. 1992;31:5269–5278. doi: 10.1021/bi00138a005. [DOI] [PubMed] [Google Scholar]
- 29.Flaherty KM, Zozulya S, Stryer L, McKay DB. Three-dimensional structure of recoverin, a calcium sensor in vision. Cell. 1993;75:709–716. doi: 10.1016/0092-8674(93)90491-8. [DOI] [PubMed] [Google Scholar]
- 30.Ames JB, Ishima R, Tanaka T, Gordon JI, Stryer L, Ikura M. Molecular mechanics of calcium-myristoyl switches. Nature. 1997;389:198–202. doi: 10.1038/38310. [DOI] [PubMed] [Google Scholar]
- 31.Bourne Y, Dannenberg J, Pollmann VV, Marchot P, Pongs O. Immunocytochemical localization and crystal structure of human frequenin (neuronal calcium sensor1) J Biol Chem. 2001;276:11949–11955. doi: 10.1074/jbc.M009373200. [DOI] [PubMed] [Google Scholar]
- 32.Lim S, Strahl T, Thorner J, Ames JB. Structure of a Ca2+-myristoyl switch protein that controls activation of a phosphatidylinositol 4-kinase in fission yeast. J Biol Chem. 2011;286:12565–12577. doi: 10.1074/jbc.M110.208868. [DOI] [PMC free article] [PubMed] [Google Scholar]
- 33.Blamey CJ, Ceccarelli C, Naik UP, Bahnson BJ. The crystal structure of calcium- and integrin-binding protein 1: insights into redox regulated functions. Protein Sci. 2005;14:1214–1221. doi: 10.1110/ps.041270805. [DOI] [PMC free article] [PubMed] [Google Scholar]
- 34.Schwieters CD, Kuszewski JJ, Tjandra N, Clore GM. The Xplor-NIH NMR molecular structure determination package. J Magn Reson. 2003;160:65–73. doi: 10.1016/s1090-7807(02)00014-9. [DOI] [PubMed] [Google Scholar]
- 35.Yap KL, Ames JB, Swindells MB, Ikura M. Diversity of conformational states and changes within the EF-hand protein superfamily. Proteins. 1999;37:499–507. doi: 10.1002/(sici)1097-0134(19991115)37:3<499::aid-prot17>3.0.co;2-y. [DOI] [PubMed] [Google Scholar]
- 36.Slupsky CM, Sykes BD. NMR solution structure of calcium-saturated skeletal muscle troponin C. Biochemistry. 1995;34:15953–15964. doi: 10.1021/bi00049a010. [DOI] [PubMed] [Google Scholar]
- 37.Zhang M, Tanaka T, Ikura M. Calcium-induced conformational transition revealed by the solution structures of apo calmodulin. Nat Struct Biol. 1995;2:758–767. doi: 10.1038/nsb0995-758. [DOI] [PubMed] [Google Scholar]
- 38.Herzberg O, Moult J, James MN. A model for the Ca2+-induced conformational transition of troponin C. A trigger for muscle contraction. J Biol Chem. 1986;261:2638–2644. [PubMed] [Google Scholar]
- 39.Ames JB, Hamasaki N, Molchanova T. Structure and calcium-binding studies of a recoverin mutant (E85Q) in an allosteric intermediate state. Biochemistry. 2002;41:5776–5787. doi: 10.1021/bi012153k. [DOI] [PubMed] [Google Scholar]
- 40.Blanchard H, Grochulski P, Li Y, Arthur JS, Davies PL, Elce JS, Cygler M. Structure of a calpain Ca(2+)-binding domain reveals a novel EF-hand and Ca(2+)-induced conformational changes. Nat Struct Biol. 1997;4:532–538. doi: 10.1038/nsb0797-532. [DOI] [PubMed] [Google Scholar]
- 41.Sia SK, Li MX, Spyracopoulos L, Gagne SM, Liu W, Putkey JA, Sykes BD. Structure of cardiac muscle troponin C unexpectedly reveals a closed regulatory domain. J Biol Chem. 1997;272:18216–18221. doi: 10.1074/jbc.272.29.18216. [DOI] [PubMed] [Google Scholar]
- 42.Sastry M, Ketchem RR, Crescenzi O, Weber C, Lubienski MJ, Hidaka H, Chazin WJ. The three-dimensional structure of Ca(2+)-bound calcyclimplications for Ca(2+)-signal transduction by S100 proteins. Structure. 1998;6:223–231. doi: 10.1016/s0969-2126(98)00023-9. [DOI] [PubMed] [Google Scholar]
- 43.Drohat AC, Baldisseri DM, Rustandi RR, Weber DJ. Solution structure of calcium-bound rat S100B(betabeta) as determined by nuclear magnetic resonance spectroscopy. Biochemistry. 1998;37:2729–2740. doi: 10.1021/bi972635p. [DOI] [PubMed] [Google Scholar]
- 44.Dick IE, Tadross MR, Liang H, Tay LH, Yang W, Yue DT. A modular switch for spatial Ca2+ selectivity in the calmodulin regulation of CaV channels. Nature. 2008;451:830–834. doi: 10.1038/nature06529. [DOI] [PMC free article] [PubMed] [Google Scholar]
- 45.Tadross MR, Dick IE, Yue DT. Mechanism of local and global Ca2+ sensing by calmodulin in complex with a Ca2+ channel. Cell. 2008;133:1228–1240. doi: 10.1016/j.cell.2008.05.025. [DOI] [PMC free article] [PubMed] [Google Scholar]
- 46.Gasmi GM, Howarth JW, Finley N, Abusamhadneh E, Gaponenko V, Brito RM, Solaro RJ, Rosevear PR. Solution structures of the C-terminal domain of cardiac troponin C free and bound to the N-terminal domain of cardiac troponin I. Biochemistry. 1999;38:8313–8322. doi: 10.1021/bi9902642. [DOI] [PubMed] [Google Scholar]
- 47.Wang X, Li MX, Sykes BD. Structure of the regulatory N-domain of human cardiac troponin C in complex with human cardiac troponin I147–163 and bepridil. J Biol Chem. 2002;277:31124–31133. doi: 10.1074/jbc.M203896200. [DOI] [PubMed] [Google Scholar]
- 48.Mori MX, Erickson MG, Yue DT. Functional stoichiometry and local enrichment of calmodulin interacting with Ca2+ channels. Science. 2004;304:432–435. doi: 10.1126/science.1093490. [DOI] [PubMed] [Google Scholar]
- 49.Zuhlke RD, Pitt GS, Deisseroth K, Tsien RW, Reuter H. Calmodulin supports both inactivation and facilitation of L-type calcium channels. Nature. 1999;399:159–162. doi: 10.1038/20200. [DOI] [PubMed] [Google Scholar]
- 50.Ottinger M, Delaglio F, Bax A. Measurement of J and dipolar couplings from simplified two-dimensional NMR spectra. J Magn Reson. 1998;131:373–378. doi: 10.1006/jmre.1998.1361. [DOI] [PubMed] [Google Scholar]
- 51.Permi P, Rosevear PR, Annila A. A set of HNCO-based experiments for measurement of residual dipolar couplings in 15N, 13C, (2H)-labeled proteins. J Biomol NMR. 2000;17:43–54. doi: 10.1023/a:1008372624615. [DOI] [PubMed] [Google Scholar]
- 52.Farrow NA, Muhandiram R, Singer AU, Pascal SM, Kay CM, Gish G, Shoelson SE, Pawson T, Kay LE. Backbone dynamics of a free and phosphopeptide-complexed Src homology 2 domain studied by 15N NMR relaxation. Biochemistry. 1994;33:5984–6003. doi: 10.1021/bi00185a040. [DOI] [PubMed] [Google Scholar]
- 53.Delaglio F, Grzesiek S, Vuister GW, Zhu G, Pfeifer J, Bax A. NMRPipe: a multidimensional spectral processing system based on UNIX pipes. J Biomol NMR. 1995;6:277–293. doi: 10.1007/BF00197809. [DOI] [PubMed] [Google Scholar]
- 54.Cornilescu G, Delaglio F, Bax A. Protein backbone angle restraints from searching a database for chemical shift and sequence homology. J Biomol NMR. 1999;13:289–302. doi: 10.1023/a:1008392405740. [DOI] [PubMed] [Google Scholar]
- 55.Nilges M, Gronenborn AM, Brunger AT, Clore GM. Determination of three-dimensional structures of proteins by simulated annealing with interproton distance restraints. Application to crambin, potato carboxypeptidase inhibitor and barley serine proteinase inhibitor 2. Protein Eng. 1988;2:27–38. doi: 10.1093/protein/2.1.27. [DOI] [PubMed] [Google Scholar]
- 56.Tjandra N, Bax A. Direct measurement of distances and angles in biomolecules by NMR in a dilute liquid crystalline medium. Science. 1997;278:1111–1114. doi: 10.1126/science.278.5340.1111. [DOI] [PubMed] [Google Scholar]
- 57.Zweckstetter M. NMR: prediction of molecular alignment from structure using the PALES software. Nat Protoc. 2008;3:679–690. doi: 10.1038/nprot.2008.36. [DOI] [PubMed] [Google Scholar]
Associated Data
This section collects any data citations, data availability statements, or supplementary materials included in this article.