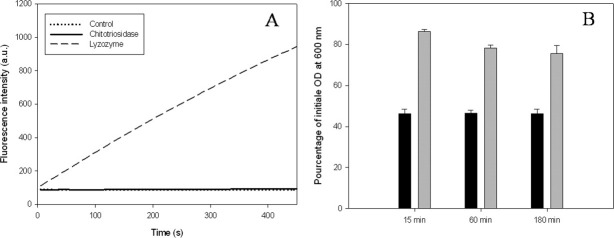
Figure 9.
Comparison of the activities of chitotriosidase and lysozyme on (A) purified fluorescein-labeled PG and (B) Bacillus subtilis cells. For the bacterial cell lysis experiment, the measured absorbance values were standardized as a percentage. 100% corresponding to the absorbance value obtained for the control (bacterial culture without added enzyme) at the same incubation time. The black and the gray bars represent the values obtained for lysozyme and chitotriosidase, respectively. This experiment has been repeated three times (each in duplicates). The bars represent the averages ± SD.

