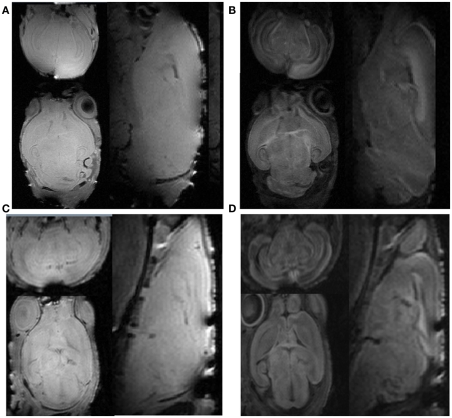
Figure 1.
The comparison of b = 0 and diffusion weighted images between the ex vivo scan and the in vivo scans. (A) Ex vivo baseline b = 0 image; (B) ex vivo diffusion weighted image; (C) in vivo baseline b = 0 image; (D) in vivo diffusion weighted image. The axial, sagittal, and coronal plane images are shown clockwise.

