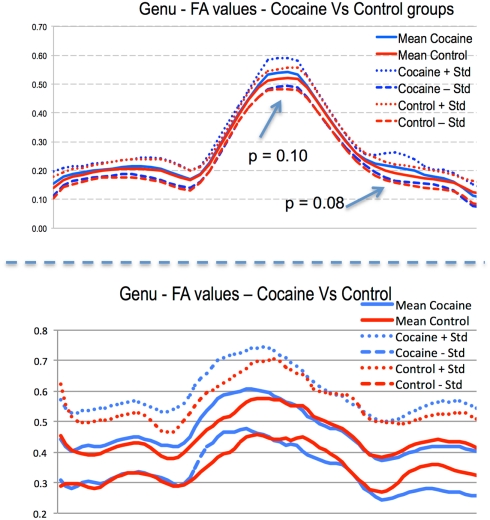
Figure 7.
Preliminary DTI–FA profile results of the genu fiber tract in the intra-uterine cocaine-exposure study (plot shows left hemisphere to right hemisphere). Top: human subjects, bottom: rodent subjects. Few locations show statistical trends with surprising similarities across-species in group differences along most of the tract.

