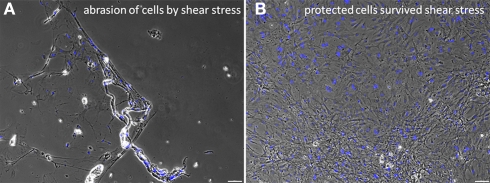
Figure 5.
Effects of shear stress examined by an abrasion experiment. Strong abrasion of the confluent cell layer due to the exerted pulling forces is visible (A). This was prevented by applying the protecting fibrin cover (B). The black dots in the right picture indicate air bubbles in the fibrin gel above the cells. Scale bars represent 100 μm (Axio Observer.Z1, Carl Zeiss GmbH, Oberkochen, Germany).

