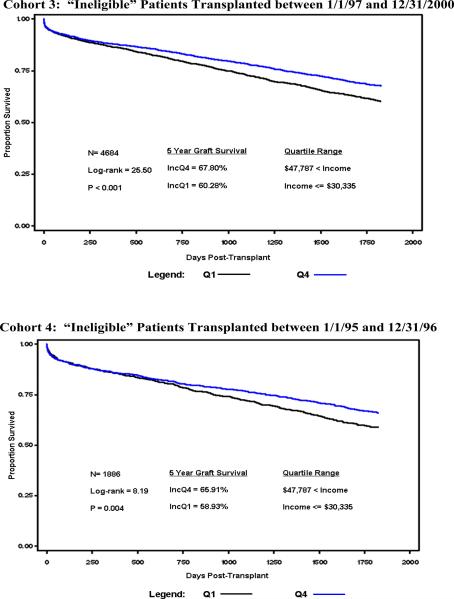
Figure 2.
Kaplan-Meier Estimates of 5-Year Graft Survival Among “Ineligible” Patients Stratified by Income Level and Era of Transplantation.
A) Patients transplanted after 1996 but ineligible for lifetime-coverage (Cohort 3).
B) Patients transplanted too soon to qualify for Medicare's lifetime coverage AND who were ineligible for lifetime coverage (Cohort 4).
The lifetime-coverage “ineligible” patients in the highest income quartile (Q4) shown in blue had better 5-year graft survival compared to those in the lowest quartile (Q1) shown in black whether they were in the early era, P<0.001, or later era, P=0.004.

