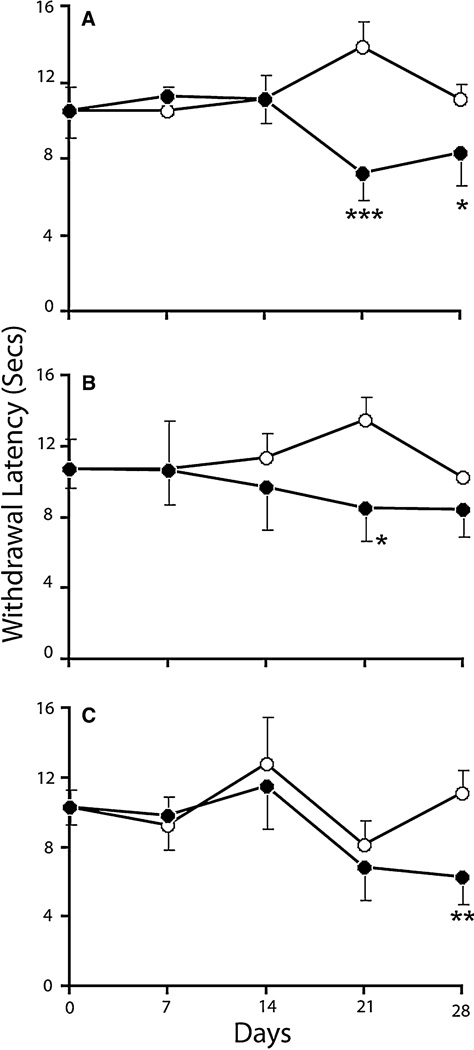
Fig. 2.
Paw withdrawal frequency in response to thermal stimuli for forelimb (a), hindpaw (b) and tail (c) of sham (open circle) and SCI (filled circle) rats at day 0, 7, 14, 21 and 28. Values are mean + SEM for sham (n = 4) and SCI (n = 7) rats. Significantly different from sham group, *P < 0.05; **P < 0.01; ***P < 0.001

