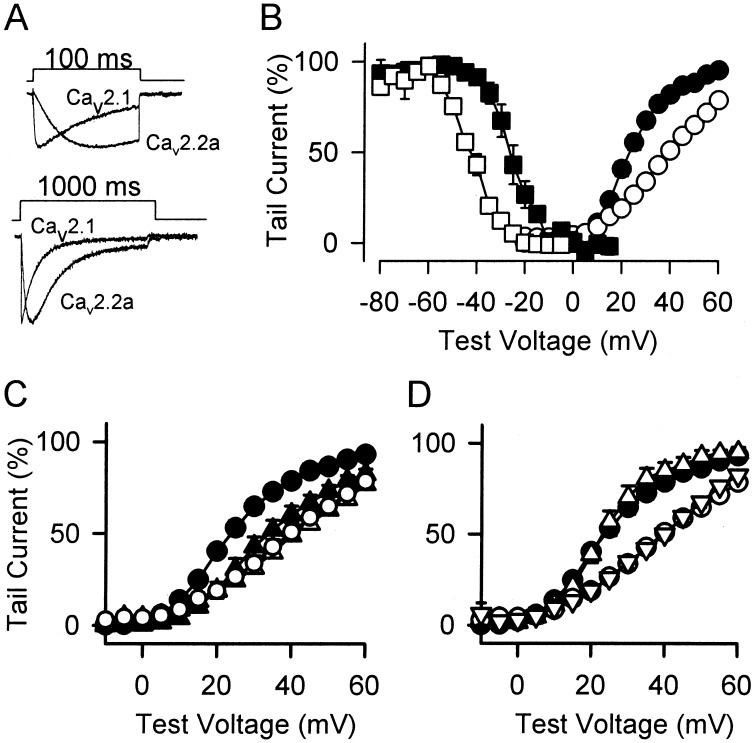
Figure 1.
Voltage-dependent activation and inactivation of the Cav2.1 and Cav2.2a Ca2+ channels. (A) Rates of activation and inactivation. Ba2+ currents were recorded during 100-ms (Upper) or 1,000-ms (Lower) pulses to +30 mV from holding potentials of −60 mV (Cav2.1) or −70 mV (Cav2.2a). (B) Voltage dependence of activation and inactivation. To measure activation, tail currents were recorded at a holding potential of −60 mV (Cav2.1) or −70 mV (Cav2.2a) after a 4-ms (Cav2.1) or 50-ms (Cav2.2a) test pulse to the indicated potential. Means ± SEM of normalized tail currents were plotted as a function of the test voltage. ●, Cav2.1; ○, Cav2.2a. To measure inactivation, tail currents were recorded after a 4-s prepulse to the indicated potential followed by a 4-ms (Cav2.1) or 10-ms (Cav2.2a) test pulse to +30 mV. Means ± SEM of normalized tail currents were plotted as a function of prepulse voltage. ▪, Cav2.1; ▫, Cav2.2a. (C) Voltage dependence of activation in the presence of intracellular GTPγS. ▴, Cav2.1; ▵, Cav2.2a. Results for activation of Cav2.1 (●) and Cav2.2a (○) in the absence of GTPγS are replotted from B for comparison. (D) Voltage dependence of activation in the absence and presence of intracellular GDPβS for Cav2.1 (●, control; ▵, GDPβS) and Cav2.2a (○, control; ▿, GDPβS).

