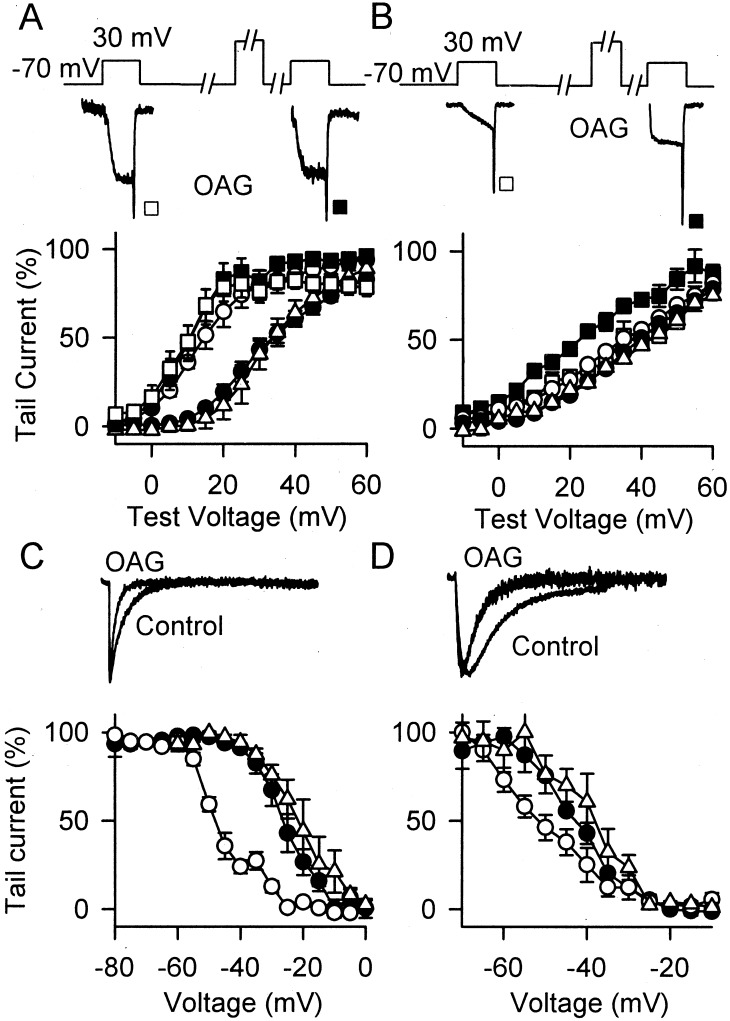
Figure 4.
Influence of PKC on Ca2+-channel gating and modulation. (A and B) Voltage dependence of activation and facilitation were measured as in Fig. 1 with and without treatment with OAG. (A) Cav2.1. Activation: ●, GTPγS; ○, GTPγS plus OAG; ▵, PKC-inhibitor peptide (IP). Facilitation: ▫, GTPγS plus OAG test 1; ▪, GTPγS plus OAG test 2. (B) Cav2.2a. ●, no addition; ○, OAG; ▵, OAG + PKC-IP. Facilitation: ▫, OAG test 1; ▪, OAG test 2. (C and D) Influence of PKC on inactivation. Voltage dependence of inactivation was measured as in Fig. 1 in the presence and absence of OAG. (C) Cav2.1: ○, OAG; ●, GTPγS; ▵, PKC-IP. (D) Cav2.2a: ○, OAG; ●, GTPγS; ▵, PKC-IP.

