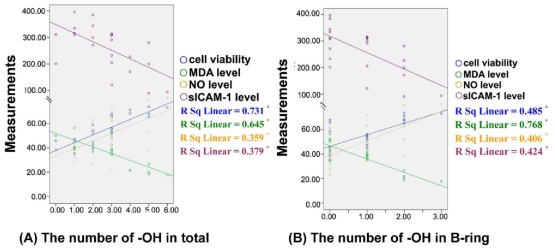
Figure 3.
Correlation between the number of −OH groups of 4-oxo-flavonoids and the inhibitory effects on oxLDL-induced endothelial dysfunction. In the scatter plot, the X axis (horizontal axis) represents the number of −OH groups of flavonoids in total (A) or in B-ring; and (B), and the Y axis (vertical axis) represents the measurements of cell viability, MDA level NO level and sICAM-1 level, respectively. The overlay scatter plots represent 23 flavonoids in different experiments, respectively. Data were analyzed by Pearson’s correlation coefficient (r) and Fisher’s r to z (p) about 23 flavonoids. * P < 0.01.

