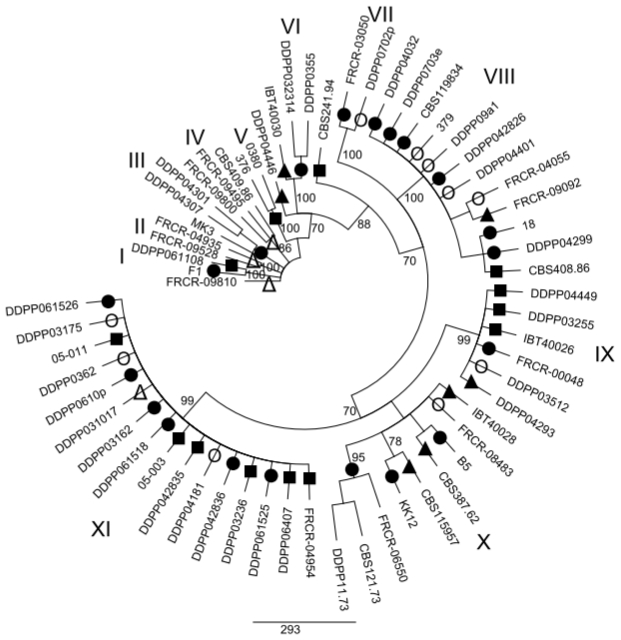
Figure 3.
Bootstrap consensus tree inferred from the MP analysis of IGS rDNA sequence data. Values at branches indicate branch support, with bootstrapping percentages based on maximum parsimony analysis. Bootstrap values ≥70% are indicated. Symbols •○Δ▴■ represent five EF1α groups shown in Figure 1 in order to visualize discord between EF1α and IGS rDNA as an example.

