Figure 5.
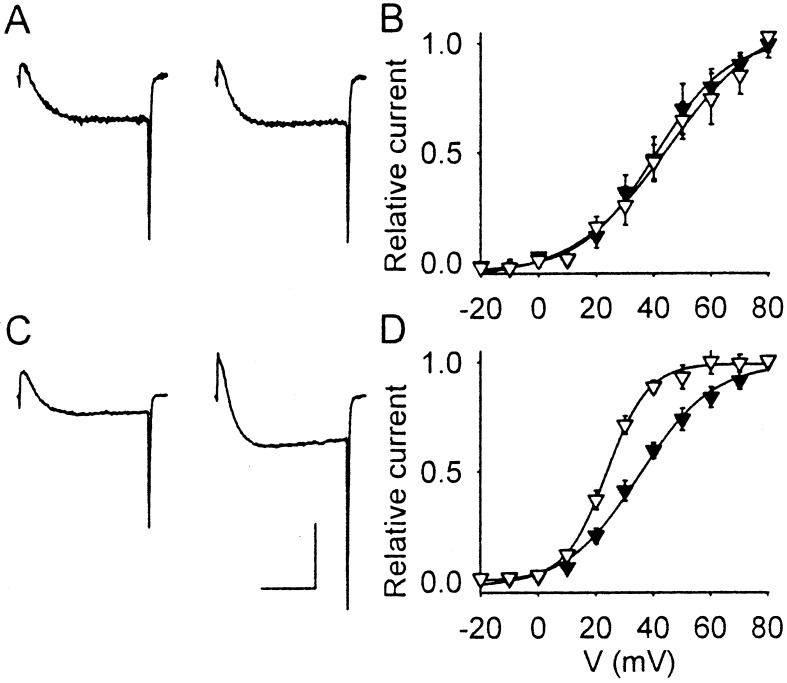
Intrinsic and GTPγS-induced facilitation of Cav2.2a(E177G) channels. (A) Prepulse facilitation of the rate of activation without GTPγS, measured as described in Fig. 2A. (B) Prepulse facilitation of the voltage dependence of activation without GTPγS. Tail currents were recorded following test 1 (▾) and test 2 (▿) at the indicated membrane potentials as described in A. Mean ± SEM of tail currents are plotted vs. test potential. (C) Prepulse facilitation of the rate of activation with 0.2 mM GTPγS in the intracellular solution, measured as in A. (D) Prepulse facilitation of the voltage dependence of activation with 0.2 mM GTPγS, measured as in B. (Scale bars: A, 0.2 nA, 4 ms; B, 2.6 nA, 4 ms.)

