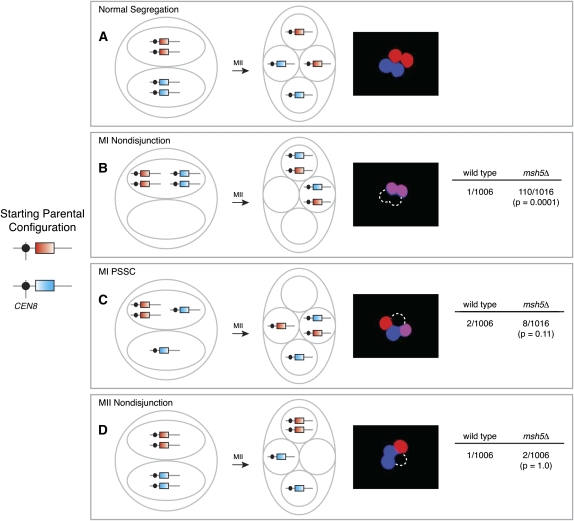
Figure 2 .
Chromosome missegregation assay. PYKL050c-RFP and PYKL050c-CFP were integrated in allelic positions near CEN8. Cartoons show configuration of the markers after MI and MII for normal segregation and different types of missegregation, and micrographs show examples of each segregation pattern. Data on the right of B–D show the frequency of each type of missegregation in diploid wild-type and msh5Δ strains, pooled from two independent cultures of each strain (≥501 tetrads/culture). Statistical significance was evaluated by Fisher’s exact test (two-tailed P-value). The complementary arrangement for MII nondisjunction was also observed (one Cfp+ spore, two Rfp+ spores, and one nonfluorescent spore; data not shown).

