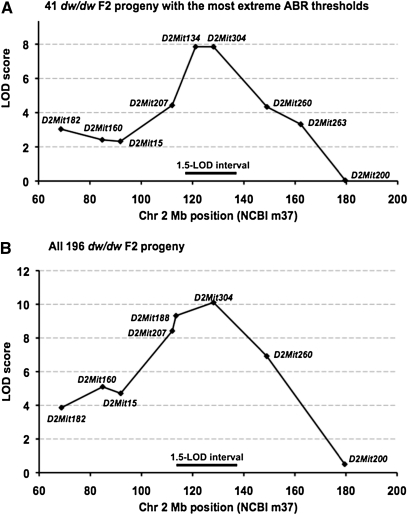
Figure 4 .
Additional mice and markers refined the map position of Mdwh on Chr 2. (A) Map position as determined from the 41 dw/dw F2 mice with the most extreme thresholds. The peak LOD scores (7.9) are for D2Mit134 at the 121-Mb position and D2Mit304 at the 128-Mb position. (B) Map position as determined from all 196 dw/dw F2 mice. The peak LOD score (10.1) is for D2Mit304 at the 128-Mb position. The 1.5-LOD support intervals for both analyses show that Mdwh is most likely located within the 118- to 138-Mb region of Chr 2.

