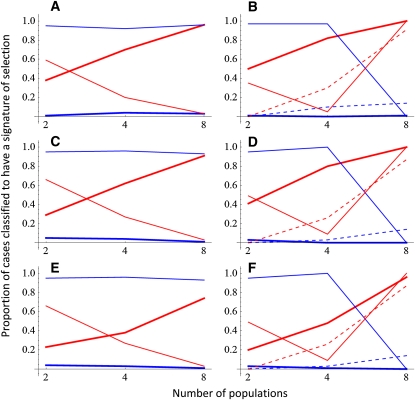
Figure 4 .
Performance of neutrality tests with simulated data that were generated with a scenario influenced by selection (red lines) or not influenced by selection (blue lines). The lines show the fraction of cases, of the 100 replicate data sets, in which the three statistical tests recovered evidence for population differentiation by selection. The thick line corresponds to the test developed in this article (with S > 0.8 as the criterion for a signal of selection), the thin solid line to the proportionality constant test of Martin et al. (2008) (with nonoverlapping confidence intervals as the criteria for a signal of selection), and the thin dashed line to the matrix proportionality test of Martin et al. (2008) (with P < 0.05 as the criterion for a signal of selection, applicable only for two or more traits). A and B depict scenario I, C and D show scenario II, and E and F show scenario III. A, C, and E and B, D, and F correspond to data sets with one and two traits, respectively.

