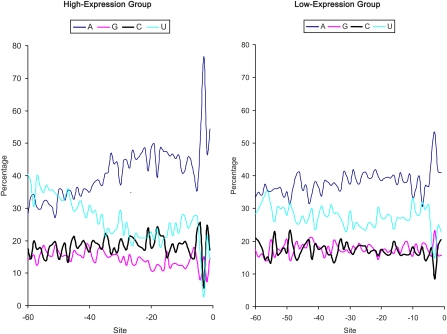
Figure 3 .
Contrasting site-specific nucleotide frequencies between highly expressed genes (500 genes with the highest predicted protein synthesis rates) and lowly expressed genes (500 genes with the lowest predicted protein synthesis rates). Protein synthesis rates are from supplemental table II in MacKay et al. (2004).

