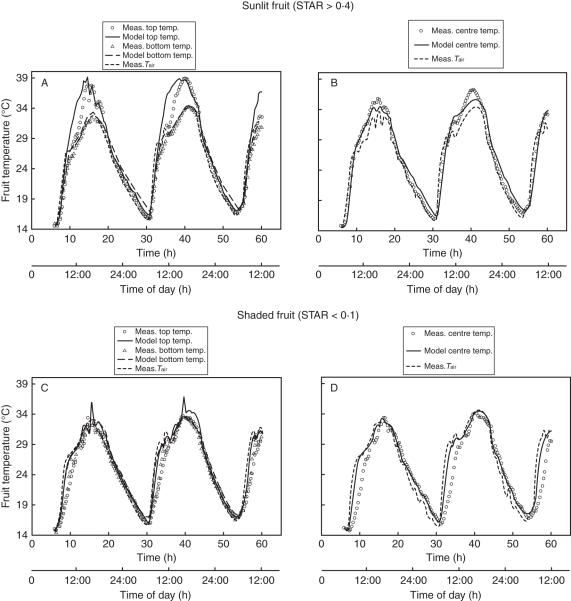
Fig. 3.
Fruit-temperature dynamics during DOY 204 and 205 for a sunlit fruit (A, B) and a shaded fruit (C, D), where simulations are shown as lines, and measurements as symbols). (A) Sunlit fruit: top-side temperature, bottom-side temperature and air temperature, as indicated. (B) Sunlit fruit: centre temperature and air temperature, as indicated. (C) Shaded fruit: top-side temperature, bottom-side temperature and air temperature, as indiacted. (D) Shaded fruit: centre temperature and air temperature, as indicated.

