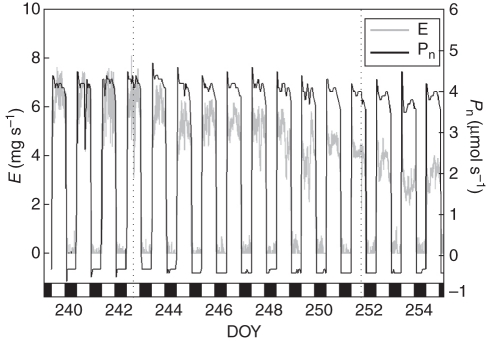
Fig. 2.
Transpiration rate (E) and net leaf photosynthesis rate (Pn) used as input variables in the water–carbon transport model. The dotted lines indicate the time of manipulation: at day of the year (DOY) 242 girdling was performed and at DOY 251 wound tissue formed was removed. Black boxes on the axis correspond to the dark periods.

