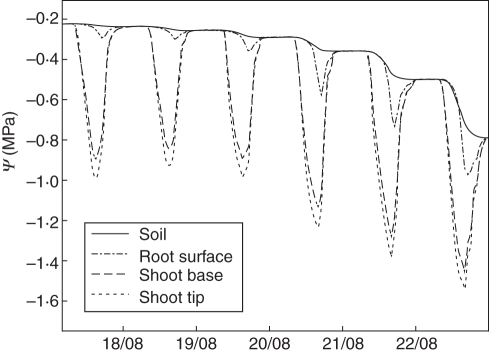
Fig. 5.
Sample of simulation outputs showing patterns of water potential at four locations (soil, root surface, at the base of a large shoot and at the tip of the same shoot) over 6 d as the soil begins to dry out. The difference between curves at any specific time indicates the gradient of water potential within the water transport model, from soil to the apex of a stem.

