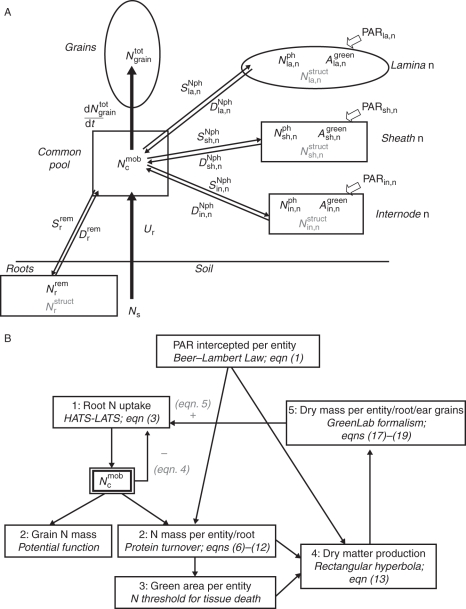
Fig. 1.
Overview of the model of N economy within a wheat (Triticum aestivum) culm after flowering. (A) Structure and functioning of N acquisition and distribution within a culm. Each lamina (la), sheath (sh) and internode (in), all chaff, all grains (grain), all roots (r) and the peduncle are represented by different modules, but only the uppermost phytomer (n), grains and roots are shown on the figure. Symbols in black represent the N-related model variables: PAR intercepted by each entity, photosynthetic N mass (Nph) and area (Agreen), remobilizable N mass in roots (Nrrem) and total N mass in grains (Ngraintot); Nstruct, the structural N mass, shown in grey, is constant throughout the grain-filling period. A supplementary module describes the mobile N pool (Ncmob), which is enriched by root N uptake and assimilation (Ur) and Nph, Nrrem degradation (DNph, Drrem), depleted by grain N filling (dNtotgrain/dt) and Nph, Nrrem synthesis (SNph, Srrem). N fluxes between modules are represented by arrows. (B) Calculations within one model time step. Each box represents one meta-process, with the calculation principle indicated as well as the numbers of the equations; the number in the box corresponds to the calculation step; the dependence between one meta-process and the others is indicated by arrows. In addition, the common pool of Ncmob is explicitly represented because of its central role in the regulation of N fluxes. The PAR intercepted by each entity is calculated once at flowering.

