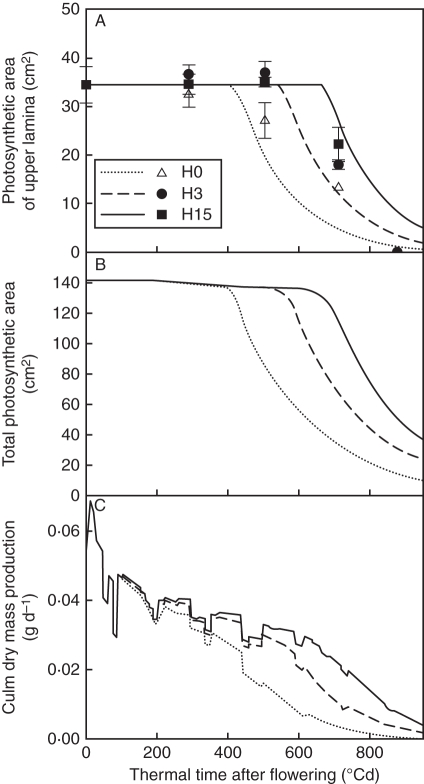
Fig. 7.
Time courses of observed (symbols) and predicted (lines) photosynthetic area of the upper lamina (A), predicted culm photosynthetic area (B) and dry mass production at the culm scale (C) for the three N treatments H0, H3 and H15. The observed data are means of three independent replicates. The vertical bars represent ± s.d.

