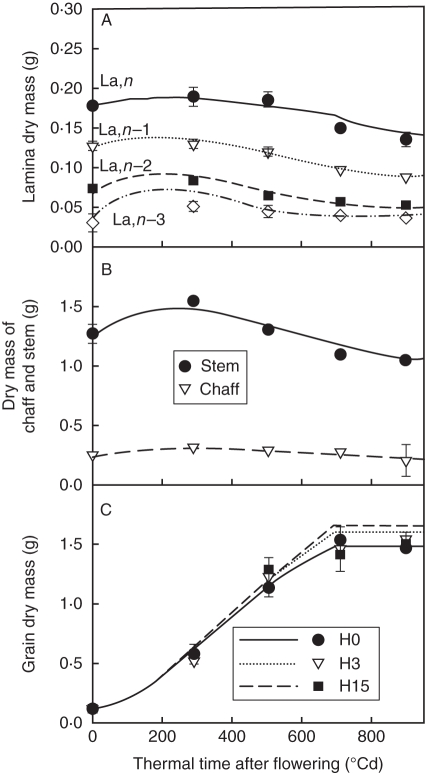
Fig. 8.
Observed (symbols) and predicted (lines) time courses of dry mass for (A) individual laminae, (B) chaff and stem (i.e. internodes, sheaths and peduncle pooled) and (C) grains. For laminae, stem and chaff, mean values of all treatments are represented; for grains, dry mass is represented for each treatment, H0, H3 and H15. The observed data are means of nine (A, B) or three (C) independent replicates. The vertical bars represent ± s.d.

