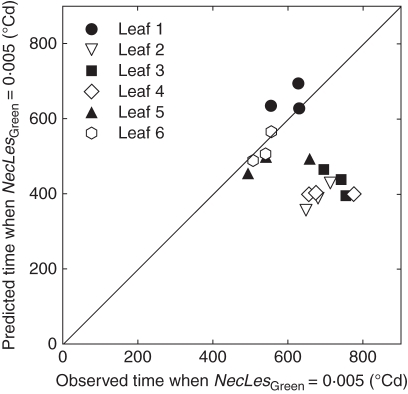
Fig. 9.
Predicted versus observed time when NecLesGreen = 0·005 for leaves 1–6, as indicated, counted from the top for the main stem of winter wheat ‘Soissons’ grown in Grignon in 2008/09 at three densities: D1 (59 plants m−2), D2 (160 plants m−2) and D3 (406 plants m−2). Time is expressed in linear thermal time (°Cd) since the average date of leaf emergence. Predictions are for the scenario that takes into account interplant variability of development (Sref). Each point corresponds to the mean value for a leaf rank in one density treatment.

