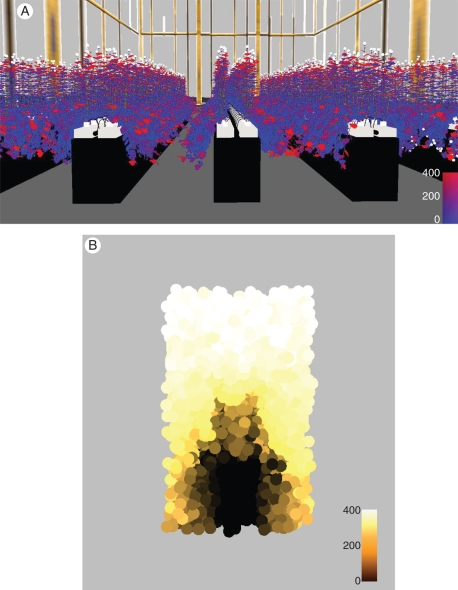
Fig. 4.
Simulated rose canopy, with (A) colour gradient (blue to red) indicating increasing amount of PAR (μmol photons m−2 leaf area s−1) absorbed per leaf, and (B) randomly distributed virtual sensors indicating the amount of incident PAR sensed within the sensor radius (5 cm), as well as colour of incident PAR (μmol photons m−2 sensor area). The snapshot shows a canopy at 1200 h, with a mixture of ambient daylight and lamp light from SON-T lamps emitting predominantly orange light.

