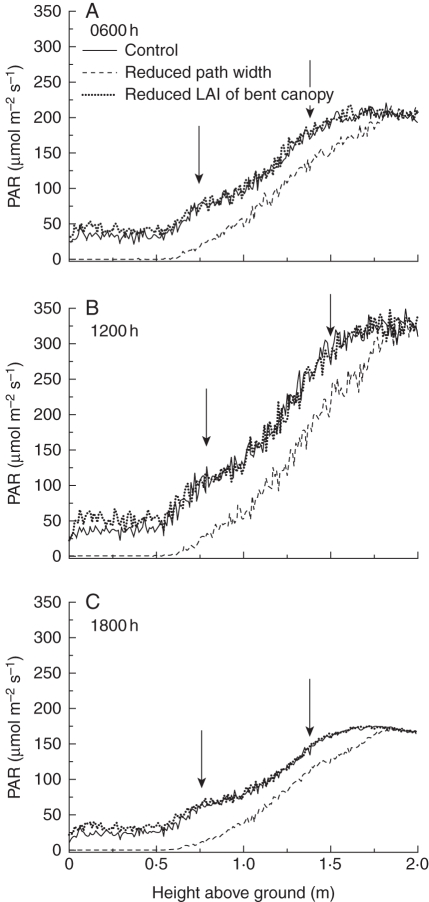
Fig. 8.
Simulated PAR level at different heights and three different times of the day (0600, 1200 and 1800 h) perceived by randomly distributed virtual sensors in a simulated rose canopy, as a function of different management scenarios: control, reduced path width, and reduced LAI of bent canopy, as indicated. Arrows indicate the height of the slab and the tip of the upright canopy.

