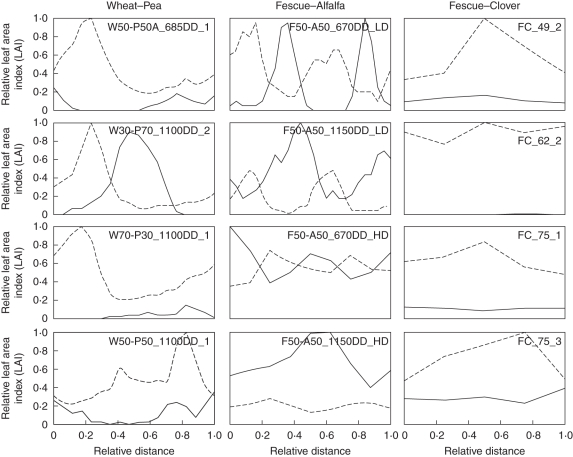
Fig. 4.
Typical horizontal distributions of leaf area index (LAI) of the wheat–pea, tall fescue–alfalfa and tall fescue–clover mixtures. See Table 1 for an explanation of the labels inside the individual graphs. Horizontal profiles of LAI are noted for grass (dashed lines) and legume (solid lines) species where each value was normalized according to (1) the distance of the first row and (2) the maximal LAI of the overall mixture.

