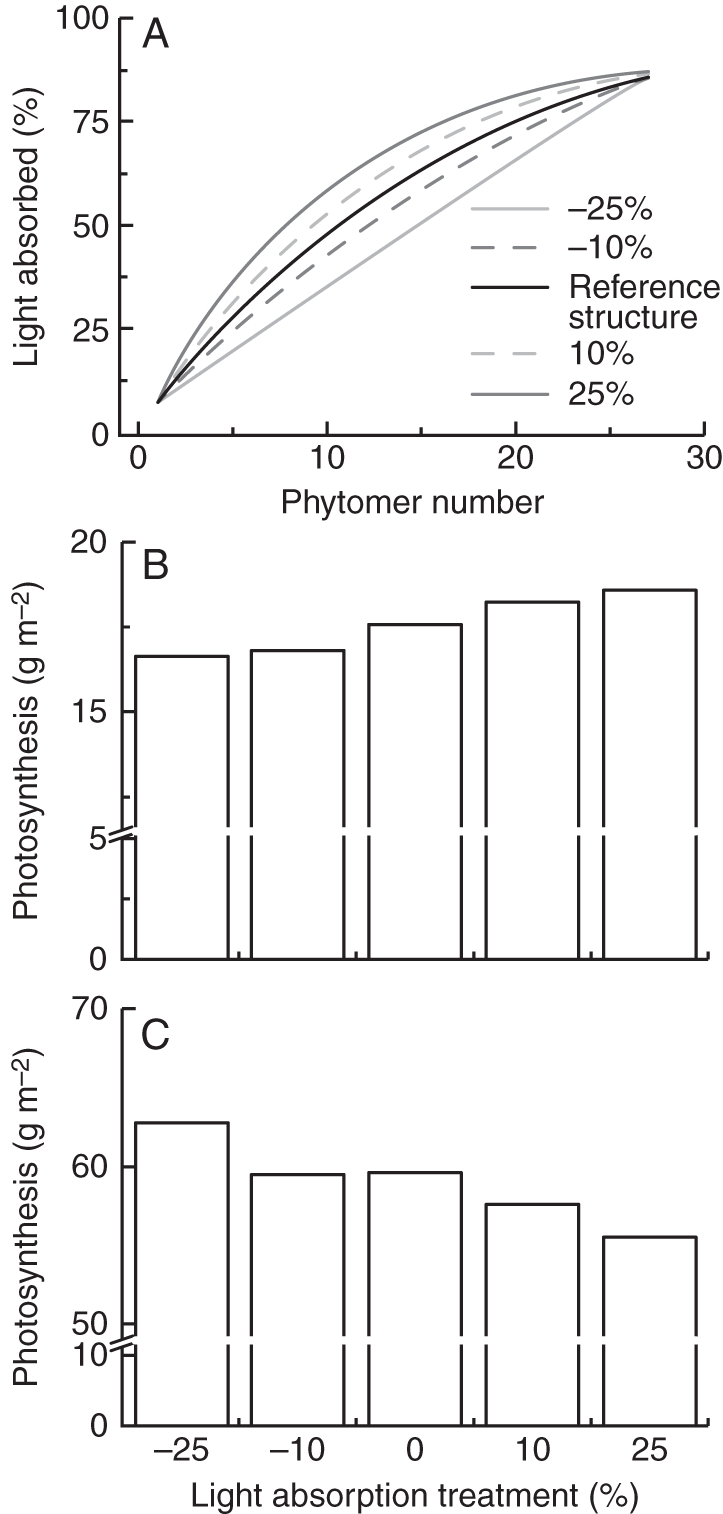
Fig. 1.

Five different vertical light absorption profiles (A) were imposed as treatments for studying the optimal profile for maximum crop photosynthesis. The absorbed light is the cumulated value from top (phytomer 1) to the bottom of the canopy. Photosynthesis at 1200 h (g CH2O m−2 h−1) is presented for each treatment for winter (B) and summer (C). Treatments for absorption profile are –25 %, –10 %, 0 %, +10 % and +25 %. These values refer to the percentage change in light absorption in the upper eight phytomers of the canopy while light absorption cumulated over the whole canopy was kept constant.
