
Figure 2.
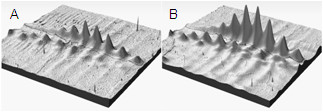
3D representation of volume of ceruloplasmin protein spots on 2D DIGE gel. Representation is for pH 4.5 - 5.5 range for second trimester samples. A) Ctl protein spots; B) DS protein spots.
Official websites use .gov
A
.gov website belongs to an official
government organization in the United States.
Secure .gov websites use HTTPS
A lock (
) or https:// means you've safely
connected to the .gov website. Share sensitive
information only on official, secure websites.
3D representation of volume of ceruloplasmin protein spots on 2D DIGE gel. Representation is for pH 4.5 - 5.5 range for second trimester samples. A) Ctl protein spots; B) DS protein spots.