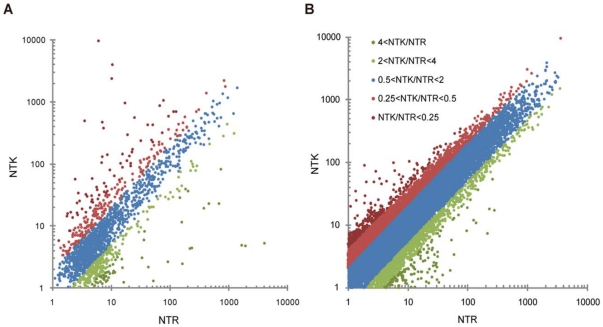
Figure 6. Scatter plot for normalized expression levels for all contigs in NTK and NTR study populations.
(A) For the de novo assembly-based strategy, 1,849 contigs were assigned to a unique gene in the NCBI nr/nt database and were used for the scatter plot, with 552 contig pairs showing more than twofold differences in expression. (B) For the mapping-based strategy, all reads from each of the 2 experimental groups were aligned to the Hokkai shrimp representative assembly, and the normalized number of the mapped reads in each group was used for the scatter plot. As a result, 11,583 contig pairs showed a greater than twofold difference in expression levels.

