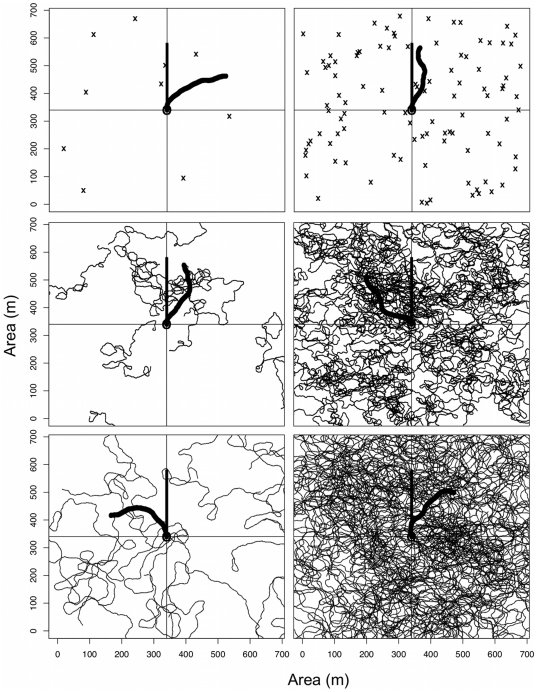
Figure 1. Example simulations showing the movement of fish with densities of 2×10⁻⁵ and 2×10⁻⁴ fish·m−2 (columns, from left to right) that moved at speeds of 0, 0.4 and 1.0 m·s−1 (rows, from top to bottom).
Three divers were simulated, the stationary point count diver remained in the centre of the sampling area (circle), the belt-transect diver followed a straight path (bold straight line), and the roving diver followed a directed random path (bold curved line) over a 60 minute survey time. Belt-transect and roving divers travelled at 4 m·min−1. The area recorded by each diver is approximated by the length and width of the line that represents them.

