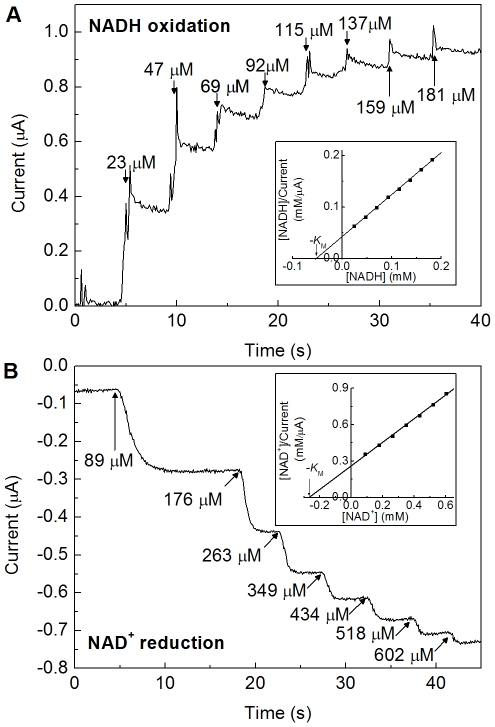
Figure 5. Electrochemical experiments designed to measure values of K M for NADH oxidation and NAD+ reduction.
(A) at −62 mV, NADH concentrations as indicated. (B) at −412 mV, NAD+ concentrations as indicated. Other conditions: Tris-HCl buffer (50 mM, pH 8.0), 30°C, electrode rotation rate: 2500 rpm. The inset panels show Hanes / Woolf plots for determination of K M; current values in (B) were corrected for a non-Faradaic current offset which is evident at zero substrate.

