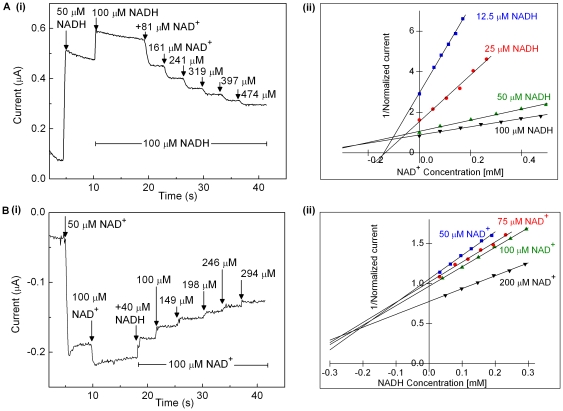
Figure 6. Demonstration of product inhibition of HoxFU.
Raw data for experiments examining NADH oxidation at −62 mV (A) and NAD+ reduction at −412 mV (B) are shown in plot (i) in each case. The substrate concentration was zero at the start of each experiment, and 50 µM substrate was then injected as indicated to provide a control step for normalization of the catalytic activity of each film. The substrate concentration was then adjusted to x µM (by dilution or addition as required. In the experiments shown in panels labelled (i), x = 100. Aliquots of the inhibitor were then injected from a stock solution containing x µM substrate in order to keep the substrate level at x µM throughout the remainder of the experiment. Panels labelled (ii) show Dixon plots presenting data from a series of such experiments. Experiments were performed at 30°C, electrode rotation rate: 2500 rpm.

