Abstract
Purpose: Burgess et al. have shown that the power-spectral density of mammographic breast tissue P(f) follows a power-law, P(f) = c/fβ.1 Due to the complexity of the breast anatomy, breast phantoms often make use of power-law backgrounds to approximate the irregular texture of breast images. However, the current methodology of estimating power-law coefficients assumes that the breast structure is isotropic. The purpose of this letter is to demonstrate that breast anatomic structure is not isotropic, but in fact has a preferred orientation. Further, we present a formalism to estimate power-law coefficients β and c while accounting for tissue orientation in mammographic regions-of-interests (ROIs). We then show the effect of structure orientation on β and c, as well as on the appearance of simulated power-law backgrounds.
Methods: When breast tissue exhibits a preferred orientation, the radial symmetry in the associated power spectrum is broken. The new symmetry was fit by an ellipsoidal model. Ellipse tilt angle and axis ratio were accounted for in the power-law fit.
Results: On average, breast structure was found to point toward the nipple: the average orientation in MLO views was 22.5 °, while it was 5 ° for CC views, and the mean orientation for left breasts was negative while it was positive for right breasts. For both power-law magnitude and exponent, the mean difference was statistically significant (<Δβ > = −0.096, <Δlog(c) > =−0.192).
Conclusions: A formalism for quantification of breast structure and structure orientation is provided. The difference in power-law coefficient estimates when accounting for orientation was found to be statistically significant. Examples of statistically defined backgrounds indicate that breast structure is mimicked more closely when structure orientation is accounted for.
INTRODUCTION
It is now well understood that the detection of breast masses in mammography is limited by the structure of the normal breast parenchyma, rather than by quantum noise.1 Burgess et al. showed that the power-spectral density of mammographic backgrounds follows a power-law, P(f) = c/fβ,1 where the power-law exponent β quantifies the texture present in the image.2
Power-law backgrounds have been widely used as a statistical model for breast backgrounds,3, 4, 5, 6, 7, 8, 9 and power-law exponents in clinical tomosynthesis and breast CT images have been investigated.10, 11
To date, power-law coefficients have been estimated from the radial averaged of the power spectrum. However, we have observed that, in general, breast structure in a mammographic ROI is oriented and therefore the corresponding periodogram does not exhibit radial symmetry. In fact, as we will show below, the power spectrum of mammographic regions-of-interests (ROIs) tends to exhibit an elliptic symmetry which we believe is due to the orientation of the breast parenchyma.
In the remainder of this letter, a formalism is presented to estimate power-law coefficients when the underlying symmetry is elliptical, and the methodology is then applied to a set of mammographic breast tissue ROIs. Finally, examples of filtered noise images will be shown to demonstrate the effect of power spectrum symmetry on the appearance of simulated background structure.
METHODS AND MATERIALS
The periodogram P(f) is an estimator of power-spectral density of an image ROI,12 defined as
| (1) |
where F{.} is the Fourier transform, f = (fx, fy) is spatial frequency, * is element-wise multiplication, and h is a Hann window to reduce spectral leakage.12 For mammographic structure, the radial average of the periodogram follows a power-law up to about 1 cycle/mm.1, 10
| (2) |
becoming constant at higher spatial frequencies and ultimately following the trend in the stochastic noise sources, such as x-ray quantum and detector noise.
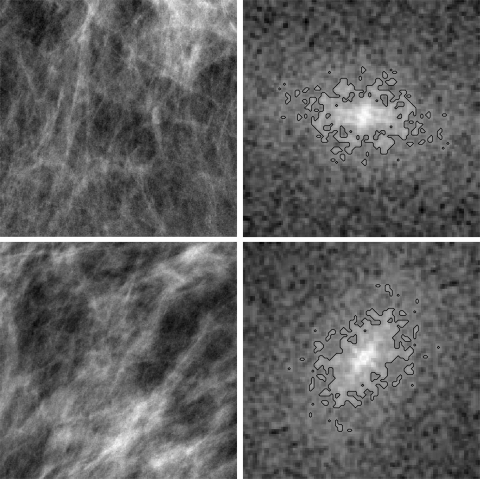
When the breast structure is not oriented, the periodogram is spherically symmetric. However, when the structure exhibits a preferred orientation, the periodogram becomes elliptic. Figure 1 shows two mammographic ROIs where the breast structure is oriented. The corresponding periodograms exhibit elliptic symmetry, and the ellipse major axis is aligned with the tissue structure’s orientation. Accounting for the ellipsoidal symmetry, the power-law coefficients c′ and β′ can now be determined relative to a scaled and rotated frequency space f ′ through
| (3) |
where R =Rθ is a 2 × 2 rotation matrix about angle, θ, between ellipse major axis and the x-axis, and Q is a 2 × 2 diagonal matrix with a diagonal elements [1, q2] where q is the ellipse major-to-minor axis ratio.
Figure 1.
Two mammographic ROIs and the center portion (100 × 100 pixels) of the corresponding periodogram. The contour lines indicate the mask that was used to estimate ellipse axis ratio q and tilt angle θ. For the top ROI, q = 1.68 and θ = −7 °. For the bottom ROI, q = 1.59 and θ = 48 °.
A periodogram mask, that included pixels with P(fx, fy) ≥ P0, was generated for each mammographic ROI. The threshold P0 was determined from the radially averaged periodogram, P0 = P(fr = 5 cycles/mm). Ellipse parameters of the mask were estimated using spatial moments.13
Ellipse axis ratio (q), tilt angle (θ), as well as power-law coefficients (β, log(c)) were estimated for a set of mammographic ROIs, assuming spherical or elliptic periodogram symmetry. In the following, unless explicitly stated, a prime indicates that elliptic symmetry was accounted for in the estimate.
Image dataset
A set of 23 normal screening cases was used in this study. Each case included the four standard mammographic views (LCC, LMLO, RCC, and RMLO). All mammograms were acquired on a GE full-field digital mammography unit (senographe DS or essential) and had been processed for display with premium view (GE). Image pixel size was 100 μm. In each mammogram, the region of uniform breast thickness was identified by eroding the skin line and excluding the pectoralis muscle in the MLO views.10 Square ROIs of 384 pixels side length were extracted, with centers spaced by 200 pixels in each direction. In total, 875 ROIs were extracted from 92 mammograms.
Filtered noise backgrounds
Filtered noise images were simulated following the approach described in Ref. 4. Briefly, a filtered noise image is the inverse Fourier transform of a complex 2D array which consists of a power-law magnitude and a random phase. The power-law coefficients and ellipse parameters were estimated from the mammographic ROIs as described above.
RESULTS AND DISCUSSION
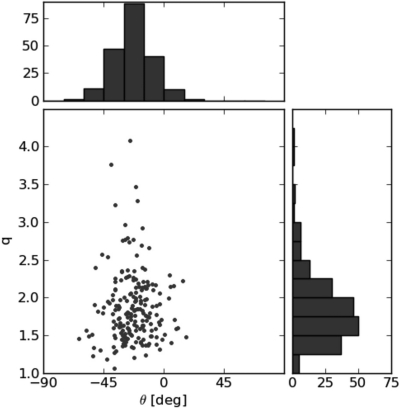
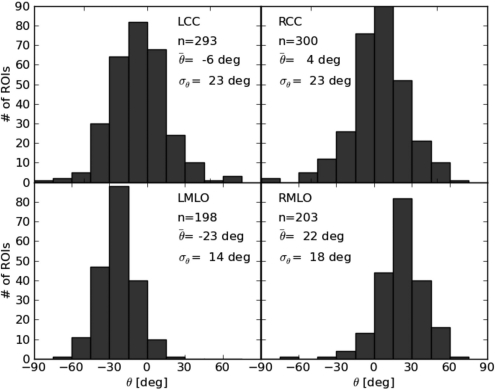
Figure 2 shows ellipse parameters θ and q for all ROIs extracted from LMLO views only. On average, the breast structure orientation is −23.2 °. In general, breast structure points toward the nipple, which is typically located in the lower right corner in a LMLO view, roughly corresponding to the observed angle. Figure 3 shows distributions of θ for all four mammographic views. On average, breast structure is oriented toward the nipple in each view.
Figure 2.
Distribution of ellipse parameters for a subset of 185 ROIs that were extracted from LMLO views (, σθ = 14 °, , σq = 0.47).
Figure 3.
Distribution of ellipse tilt angles in the four mammographic views. The number of ROIs extracted for each view is given by n.
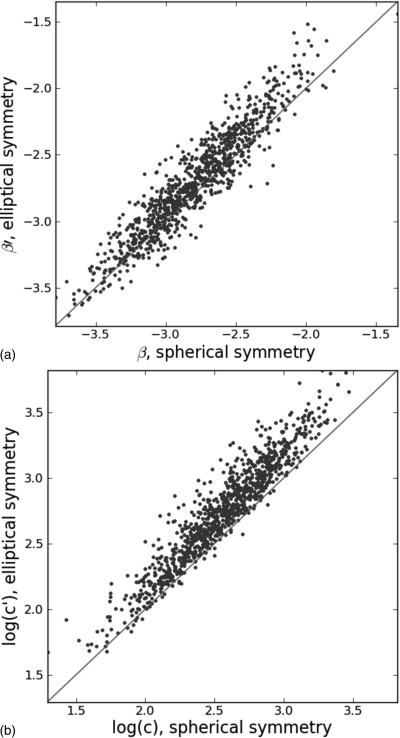
The effect of periodogram symmetry on the estimates of the power-law coefficients is shown in Fig. 4. As expected, the correlation between coefficients estimated with the two approaches is high. However, for most ROIs, the actual values of both power-law coefficients differ, and the distribution means of both β and log(c) are not equal. Distribution means and standard deviations for β and log(c), as well as the mean differences Δβ = β − β′ and Δlog(c) = log(c) − log(c′) are listed in Table TABLE I.. A paired t-test was performed on Δβ and Δlog(c). Both mean differences were found to be statistically significant (p < 0.001) for all ROIs, as well as for ROIs from individual views.
Figure 4.
Scatter plots of (a) β and (b) log(c) estimated assuming spherical or elliptic symmetry. Distribution statistics are listed in Table TABLE I..
Table 1.
Mean and standard deviation of β and log(c) in all 875 ROIs, estimated assuming spherical or elliptical symmetry of the periodogram. The mean difference is shown along with 95% confidence intervals.
| Spherical symmetry | Elliptical symmetry | Mean difference | |||
|---|---|---|---|---|---|
| mean | std | mean | std | (ell-sph) | |
| β | −2.80 | 0.35 | −2.70 | 0.39 | −0.096a [−0.088,−0.104] |
| log(c) | 2.55 | 0.35 | 2.75 | 0.39 | −0.192a [−0.18, −0.200] |
p < 0.001.
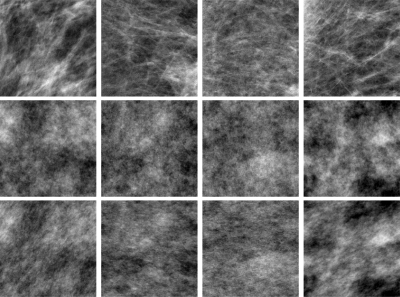
Figure 5 shows examples of breast regions, along with filtered noise regions that were simulated using a spectrum magnitude with radial symmetry, or elliptical symmetry (producing a directionality in the filtered noise image). The appearance of the oriented filtered noise samples mimic that of the actual breast structure more closely. Thus, such backgrounds may be a better representative of actual anatomy. The effect of the two types of backgrounds on detection and estimation task performance will likely depend on the task,14 i.e., the symmetry of the signal and its alignment relative to the background orientation.
Figure 5.
Examples of mammographic ROIs (top row) and corresponding filtered noise samples, based on spherical symmetry (center row) and ellipsoidal symmetry (bottom row) of the periodogram. The display window is equal for each ROI and its two corresponding filtered noise images, but may differ between ROIs. The first two ROIs are also shown in Fig. 1.
CONCLUSIONS
The orientation of mammographic breast structure has been quantified, and its effect on power-law parameters β and log(c) has been investigated. Accounting for the elliptical asymmetry of the periodogram did decrease the distribution means for β and log(c), and the mean difference was statistically significant. The appearance of filtered noise, which is often used as a surrogate for breast structure in assessment studies, appears more realistic when the true symmetry of the periodogram is taken into account.
ACKNOWLEDGMENTS
This work was funded in part by NCI R21 EB008801. RM Nishikawa is a shareholder in, a consultant to, and receives royalties from Hologic, Inc. and Riverain, Medical.
References
- Burgess A. E., Jacobson F. L., and Judy P. F., “Human observer detection experiments with mammograms and power-law noise,” Med. Phys. 28, 419–437 (2001). 10.1118/1.1355308 [DOI] [PubMed] [Google Scholar]
- Burgess A. E. and Judy P. F., “Signal detection in power-law noise: Effect of spectrum exponents,” J. Opt. Soc. Am. A 24, B52–B60 (2007). 10.1364/JOSAA.24.000B52 [DOI] [PubMed] [Google Scholar]
- Richard S. and Samei E., “Quantitative imaging in breast tomosynthesis and CT: Comparison of detection and estimation task performance,” Med. Phys. 37(6), 2627–2637 (2010). 10.1118/1.3429025 [DOI] [PubMed] [Google Scholar]
- Reiser I. and Nishikawa R. M., “Task-based assessment of breast tomosynthesis: Effect of acquisition parameters and quantum noise,” Med. Phys. 37(4), 1591–1600 (2010). 10.1118/1.3357288 [DOI] [PMC free article] [PubMed] [Google Scholar]
- Gong X., Glick S. J., Liu B., Vdula A. A., and Thacker S., “A computer simulation study comparing lesion detection accuracy with digital mammography, breast tomosynthesis, and cone-beam CT breast imaging,” Med. Phys. 33, 1041–1052 (2006). 10.1118/1.2174127 [DOI] [PubMed] [Google Scholar]
- Gang G. J., Tward D. J., Lee J., and Siewerdsen J. H., “Anatomical background and generalized detectability in tomosynthesis and cone-beam CT,” Med. Phys. 37(5), 1948–1965 (2010). 10.1118/1.3352586 [DOI] [PMC free article] [PubMed] [Google Scholar]
- Chen B., Shorey J., Saunders R. S., Richard S., Thompson J., Nolte L. W., and Samei E., “An anthropomorphic breast model for breast imaging simulation and optimization,” Acad. Radiol. 18(5), 536–546 (2011). 10.1016/j.acra.2010.11.009 [DOI] [PubMed] [Google Scholar]
- Ma A. K. W., Gunn S., and Darambara D. G., “Introducing DeBRa: A detailed breast model for radiological studies,” Phys. Med. Biol. 54(14), 4533–4545 (2009). 10.1088/0031-9155/54/14/010 [DOI] [PubMed] [Google Scholar]
- Bliznakova K., Bliznakov Z., Bravou V., Kolitsi Z., and Pallikarakis N., “A three-dimensional breast software phantom for mammography simulation,” Phys. Med. Biol. 48, 3699–3719 (2003). 10.1088/0031-9155/48/22/006 [DOI] [PubMed] [Google Scholar]
- Engstrom E., Reiser I., and Nishikawa R. M., “Comparison of power spectra for tomosynthesis projections and reconstructed images,” Med. Phys. 36, 1753–1758 (2009). 10.1118/1.3116774 [DOI] [PMC free article] [PubMed] [Google Scholar]
- Metheany K. G., Abbey C. K., Packard N., and Boone J. M., “Characterizing anatomical variability in breast CT images,” Med. Phys. 35, 4685–4694 (2008). 10.1118/1.2977772 [DOI] [PMC free article] [PubMed] [Google Scholar]
- Percival and Walden , Spectral Analyis for Physical Applications (Cambridge University Press, Cambridge, New York, 1993). [Google Scholar]
- Pratt W. K., Digital Image Processing (John Wiley & Sons, New York, 2001). [Google Scholar]
- Barrett H. H. and Myers K. J., Foundations of Image Science (Wiley Interscience, Hoboken, N. J., 2004). [Google Scholar]


