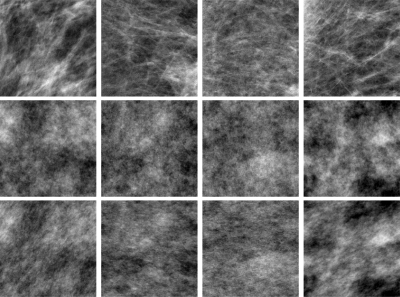
Figure 5.
Examples of mammographic ROIs (top row) and corresponding filtered noise samples, based on spherical symmetry (center row) and ellipsoidal symmetry (bottom row) of the periodogram. The display window is equal for each ROI and its two corresponding filtered noise images, but may differ between ROIs. The first two ROIs are also shown in Fig. 1.

