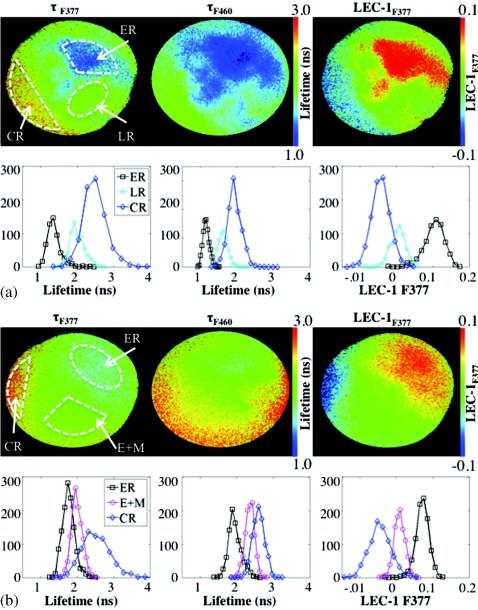
Figure 3.
FLIM-derived parameters: τF377, τF460, and LEC-1F377 from two aorta samples depicted in (a) and (b), respectively. ROIs are outlined (white dashed line) for ER, E+M, CR, and LR groups. Beneath each image are corresponding histograms, the y axis represents number of pixels. The diameter of the field of view of the FLIM images is 4 mm in all cases.

