
Fig 3.
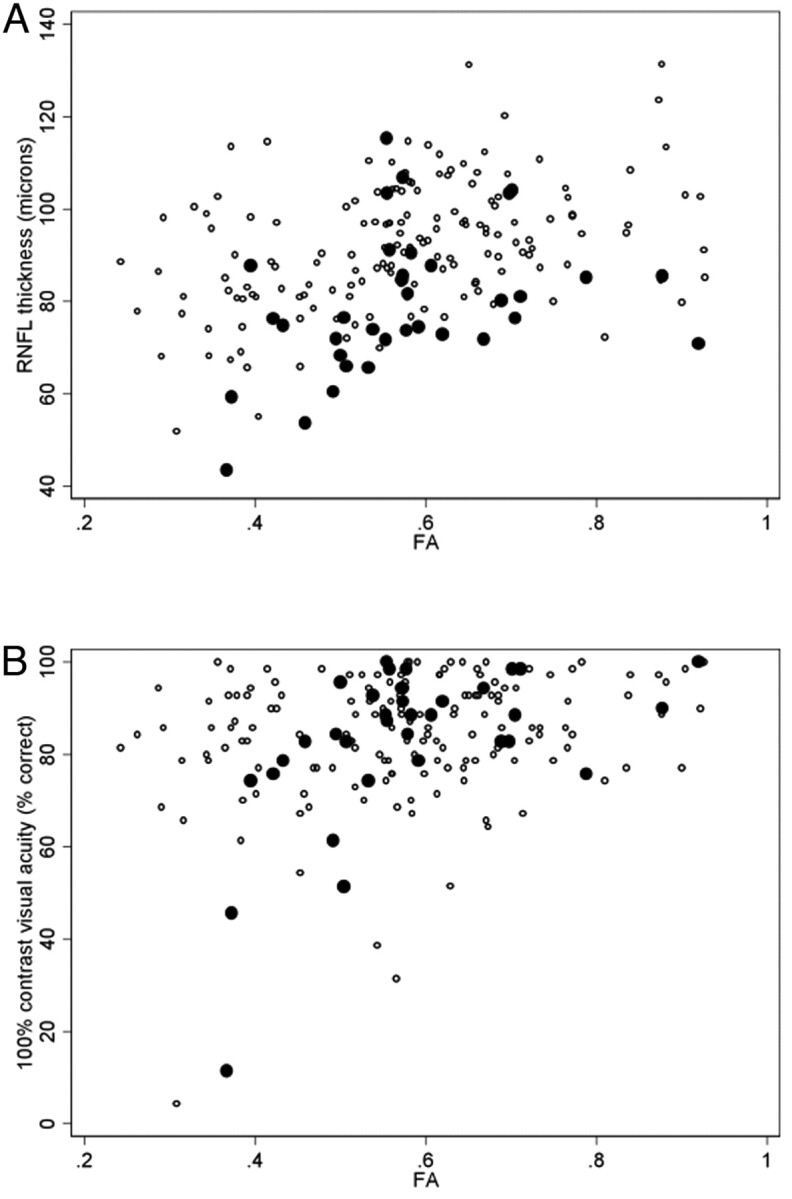
Scatterplots showing the association between FA and PRNFL thickness (A) and high contrast visual acuity (B) in optic nerves without (○) and with (●) previous ON.
Official websites use .gov
A
.gov website belongs to an official
government organization in the United States.
Secure .gov websites use HTTPS
A lock (
) or https:// means you've safely
connected to the .gov website. Share sensitive
information only on official, secure websites.
Scatterplots showing the association between FA and PRNFL thickness (A) and high contrast visual acuity (B) in optic nerves without (○) and with (●) previous ON.