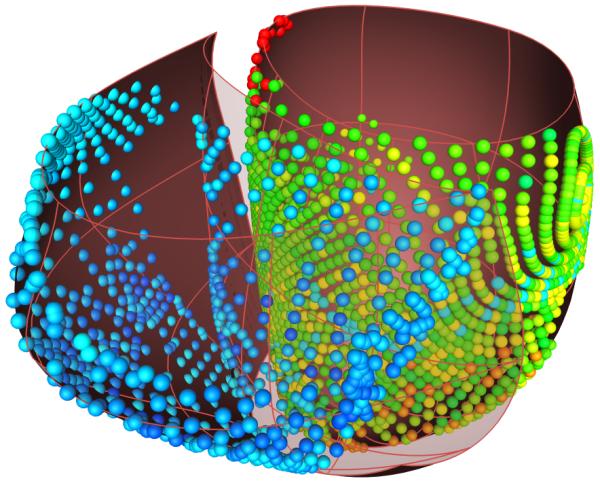
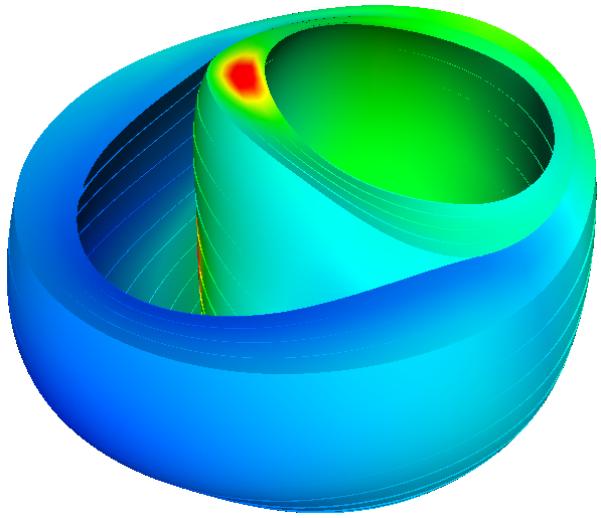
Figure 4.


Electroanatomic map measurements of LBBB (left) projected to the end-diastolic mesh and resulting activation times (right) from the computational model [ms]. Red indicates the latest activated region, coinciding with the basal location of a scar.
